The Greater Bay Area Cancer Registry Annual Reporting of Cancer Incidence and Mortality Rates and Trends, 1988-2020
This year’s Greater Bay Area Annual Cancer Incidence and Mortality Report highlights significant findings for cancer incidence and mortality from 1988 through 2020. In addition to presentation of recent incidence and mortality data, we assessed the impact of COVID-19 pandemic on incident cancer cases in 2020.
Impact of the COVID-19 Pandemic on New Cancer Cases in the Greater Bay Area
The COVID-19 pandemic impacted access to cancer-related healthcare services throughout the United States (U.S.), reducing screening rates and delaying cancer diagnoses. In the Greater Bay Area, the age-standardized incidence rates of total cancer in the U.S. in 2020 were 9.6% and 9.3% less among men and women, respectively, than what was observed in 2019. The National Cancer Institute (NCI) Surveillance, Epidemiology and End Results (SEER) program published a summary of the impact of the COVID-19 pandemic on 2020 SEER cancer incidence data: https://seer.cancer.gov/data/covid-impact.html. The Greater Bay Area Cancer Registry contributes data to the SEER program. Given the impact of the pandemic on cancer data, the NCI recommended not including 2020 incidence data in estimation of trends over time or models that predict risk of developing cancer. Following the NCI’s recommendation, we present the incidence rates in 2020, overall and by cancer type, in this year’s annual report, but do not include the 2020 data in incidence trend estimates.
To understand how the pandemic impacted cancer diagnoses in the Greater Bay Area specifically, we compared the observed versus expected number of incident cases in 2020, overall and for five common cancers from 2015-2019 (breast, prostate, lung and bronchus, colon and rectum, and melanoma of the skin), by race and ethnicity [Asian American/Pacific Islander (AAPI), Hispanic, non-Hispanic (NH) Black, NH White], and by age (<65 vs. 65+ years). Expected numbers of cases in 2020 were calculated using joinpoint regression models with data from 2001-2019.
For all sites combined, the observed number of cancer cases in 2020 was 10.0% less than expected. The magnitude of the lower number of observed cases was slightly variable by race and ethnicity and age, with the largest difference among the Asian American and Pacific Islander (AAPI) population where the observed number of new cases was 12.9% lower than expected.
The difference between the observed and expected number of cases in 2020 varied considerably by cancer site. Among 5 of the most common cancers, the largest difference was in female invasive breast cancer, with the observed number of cases 16.8% lower than expected, 14.5% lower among women 65 years and younger and 19.9% lower among women older than 65. Among AAPI and Hispanic women, observed cases of female invasive breast cancer were 20.2% and 19.7% lower than expected, respectively, followed by 16.4% lower among NH White women and 8.0% lower among NH Black women. Observed cases of lung cancer were 11.2% lower than expected overall: 16.6% and 16.4% lower among the AAPI and Hispanic populations, respectively; 13.4% lower among the NH Black population; and 10.0% lower among the NH White population. The difference between observed versus expected was slightly larger among people less than 65 years (-13.8%) compared to people 65 years and older (-10.7%). Observed cases of colorectal cancer were 8.6% lower than expected overall: 9.7% lower among the NH White population, 9.2% lower among the Hispanic population, and 6.1% and 3.7% lower among the AAPI and NH Black populations, respectively. Notably, the observed number of cases among people less than 65 years was 14.8% lower than expected versus 7.4% lower than expected among those 65 or older. Observed cases of prostate cancer were 8.0% lower than expected overall: 15.5% and 14.2% lower among NH Black and AAPI males, respectively, 7.0% lower among NH White males, and 3.5% higher than expected among Hispanic males. The difference between observed and expected prostate cases was driven by people less than 65 years, who had an 11.4% lower than expected number of cases. Among those 65 and over, observed cases were 10.5% higher than expected. This higher observed than expected count in the older age group could be reflective of the increasing incidence of prostate cancer that has been observed nationwide over the past several years and changes in patterns of prostate cancer screening. Finally, regarding melanoma of the skin, there were no differences in the observed versus expected number of cases.
In summary, of these five common cancers in the Greater Bay Area from 2015-2019, the COVID-19 pandemic had the greatest impact on the detection of female invasive breast cancer, among all races and ethnicities, with particularly low (compared to expected) number of cases observed in 2020 among the AAPI and Hispanic populations. Notably large differences in observed versus expected numbers were also seen among AAPI and Hispanic populations for lung cancer and among AAPI and NH Black males for prostate cancer. The relatively smaller difference in observed versus expected cases for colorectal cancer, particularly among the NH Black population and those over 65 years, may be due in part to the availability of at-home screening tests for colorectal cancer, and suggests that efforts to maintain access to this important screening tool for high-risk populations in the Greater Bay Area during the pandemic led to smaller observed declines in case counts than for most other cancer sites. Nevertheless, the lower observed versus expected number of cases for many screening-detected cancers in 2020 may lead to a higher number of cases in subsequent years, with potentially higher incidence of advanced stage disease.
Introduction
The Greater Bay Area Cancer Registry (GBACR), part of the California Cancer Registry (CCR) and the SEER program, is operated by the University of California at San Francisco (UCSF) and collects information on all newly diagnosed cancers occurring in residents of nine Greater Bay Area counties: Alameda, Contra Costa, Marin, Monterey, San Benito, San Francisco, San Mateo, Santa Clara, and Santa Cruz. Statewide cancer reporting in California began in 1988. At present, the most recent year of complete case ascertainment and follow-up for deaths is 2020.
Infographics in this report highlight current cancer statistics for the most common invasive cancers in the Greater Bay Area (invasive cancers are defined as tumors that have spread beyond the tissue or origin or to other parts of the body). These include data on new cases of cancer and cancer deaths for the 33-year period from 1988 through 2020. The site-specific information reports on the incidence and mortality of the top 20 invasive cancers, examining trends, and highlighting the latest available five years of data from 2016-2020 for the nine Greater Bay Area counties. For average annual changes in rates, data was suppressed when less than 15 cancer cases were recorded in any given year. For these instances, data for males or females, or certain racial or ethnic groups may be missing, and between-group comparisons may not be reported. Cancer rates from the entire state are also included for comparison.
Since 1988, the overall incidence and mortality rates of cancer (calculated as number of new cases and deaths per 100,000 individuals, respectively) have greatly decreased in the Greater Bay Area. For each cancer site, there are notable differences in rates by sex, race, and ethnicity, but overall, there are promising patterns of decreasing incidence and mortality for most cancer sites. It is of note that population estimate data for calculating age-adjusted incidence rates for detailed AAPI ethnicities as well as other granular racial and ethnic groups are needed for cancer surveillance in our diverse communities; yet these data are not available from the Census for recent years, including 2020. For highly heterogenous population groups, current limitations in available population estimate data preclude systematic surveillance of cancer rate trends in detailed ethnic groups. In the presented infographics, we focus on sex- and racial and ethnic-specific cancer rates and trends seen among aggregated racial and ethnic groups including the AAPI, Hispanic, NH Black and NH White populations.
Tools
In addition to this report, there are several interactive tools available to further explore cancer statistics:
- GBACR Dashboard which provides both cancer incidence and mortality rates by county, race, ethnicity, sex, age, and year of diagnosis.
- California Health Maps website allows users to access incidence rates for several geographies, including census tract aggregation zones, medical service study areas, census designated places, and legislative districts.
- Cal*Explorer is an interactive website that provides easy access to a wide range of CCR cancer statistics. It provides detailed statistics for cancer sites by gender, race, age, region, and for a selected number of cancer sites, by histology.
Glossary of Technical Terms
Analytic Terms
Incidence: The number of new cases of cancer diagnosed in a certain period of time. In this report, incidence data are based on the number of new cases of cancer diagnosed in residents of the Greater Bay Area over the period January 1, 1988 through December 31, 2020.
Mortality: The number of deaths due to cancer in a certain period of time. In this report, mortality data are based on the number of deaths from cancer in residents of the Greater Bay Area over the period January 1, 1988 through December 31, 2020.
Incidence/mortality rate: The number of new cancer cases (incidence) or deaths (mortality) in a certain period of time in a specific population, divided by the size of that population. Incidence and mortality rates are expressed per 100,000 population. In this report, annual and cumulative (or average) 5-year incidence and mortality rates are presented.
Confidence interval: A statistical measure of the precision of the observed incidence or mortality rate. The observed rate is an estimate of the true rate based on counts of cancer cases (or deaths) and of the population, and is subject to variation from the true value of the rate. The confidence interval for the observed rate is a range of values within which the true rate is thought to lie, with a specified level of confidence, e.g., 95%. Rates based on larger numbers of cases (or deaths) are subject to less variation.
Age-adjusted incidence/mortality rate: Age-adjustment is a statistical method that allows comparisons of incidence and mortality to be made between populations with different age distributions. An age-adjusted cancer incidence (or mortality) rate is defined as the number of new cancers (or deaths) per 100,000 population that would occur in a certain period of time if that population had a ‘standard’ age distribution. In this report, incidence and mortality rates are age-adjusted using the U.S. 2000 Standard Population.
Trend: Used to describe the change in the incidence or mortality rate over time. The Annual Percent Change (APC) is used to measure trends. For example, incidence rates may rise gradually over a period of several years, then drop sharply for several years. Statistical criteria are used to quantify the magnitude of change over a period of time.
Race and ethnicity: In this report, race and ethnicity are categorized as: All races and ethnicities, Asian American/Pacific Islander (AAPI), Hispanic, non-Hispanic (NH) Black, or NH White. “All races and ethnicities” category includes the four categories listed plus American Indian/Alaska Native (AIAN) people and people with another or unknown race and ethnicity. The latter two groups are not consistently reported separately due to small numbers for many cancer sites (<15 cases).
Cancer Terms
Carcinoma: Cancer that begins in the skin or in tissues that line or cover internal organs.
Histology: The study of tissues and cells under a microscope. Cancers are identified and diagnosed primarily on the basis of histology. They often are classified further by histologic subtype.
In situ: Meaning ‘in its original place’. For example, in carcinoma in situ, abnormal cells are found only in the place where they first formed and have not spread.
Invasive: Cancer that has spread beyond the layer of tissue in which it developed and is growing into surrounding, healthy tissues. Also called infiltrating cancer. Invasive tumors are classified according to how far the cancer has spread at the time of diagnosis.
Malignant: Cancerous cells that can invade and destroy nearby tissue and spread to other parts of the body.
Stage: The extent of the cancer in the body, such as how large the tumor is, and if it has spread. In this report, four categories of stage are used: (1) In situ (see above), (2) localized – cancer is limited to the place where it started with no sign that it has spread, (3) regional – cancer has spread to nearby lymph nodes, tissues or organs, (4) distant – cancer has spread to distant parts of the body.
Risk Factor: A characteristic that is associated with the disease; a variable that may increase the chances of getting a specific type of cancer.
Population data used for denominators in cancer rates
For the GBACR Annual Report, we utilized annual population estimate data provided by the National Center for Health Statistics (NCHS). The NCHS annual population estimate data are extrapolated from the 2010 Census, as 2020 Census data for rate calculations are not yet released. Until the next decennial census data (e.g., 2000 Census) are available, we are dependent upon extrapolated data from the last decennial census (e.g., 2010 Census), thus cautions should be taken in interpreting cancer incidence and mortality trends and rates.
Incidence and Mortality in the Greater Bay Area, 1988-2020
Rates of invasive cancers have decreased significantly during the 33-year period from 1988 through 2020 in the Greater Bay Area. Significant declines were also noted by the American Cancer Society in their Annual Cancer Statistics report [1]. This is likely the result of the decline in incidence of many cancers due in part to changes in cancer screening guidelines (e.g., colonoscopy at age 45) and the reduction in smoking prevalence [1,2].
The five most common invasive cancers—breast, prostate, lung and bronchus, colorectal, and uterine—accounted for slightly over half of all newly diagnosed cancers in the Greater Bay Area. Lung and bronchus, breast, prostate, colorectal, and pancreatic cancers were the most common cause of cancer deaths, collectively accounting for half of all cancer deaths in the Greater Bay Area.
Incidence (1988-2019) and Mortality (1988-2020) Trends
- The annual percent decrease in incidence rates from 1988 through 2019 (excluding the 2020 for overall incidence trend) was substantially greater for males (-0.9%) than females (-0.2%), driven largely by declines in the incidence rates of smoking-related cancers and prostate cancer in males.
- As with overall cancer incidence, mortality rates also declined dramatically from 1988 through 2020 in the Greater Bay Area. A slightly larger decline occurred for males (-2.1%) than females (-1.8%).

Incidence, 2016-2020
- The incidence rate of all invasive cancers from 2016-2020 was higher in males than females.
- Males: the incidence rate was highest among NH Black males (470.4 per 100,000), followed by NH White (465.9 per 100,000), Hispanic (344.0 per 100,000), and AAPI males (284.8 per 100,000).
- Females: White females had the highest incidence rate (423.4 per 100,000), followed by NH Black (390.9 per 100,000), Hispanic (326.4 per 100,000), and AAPI (304.4 per 100,000) females.
- Among Greater Bay Area counties, Marin County had the highest overall cancer incidence rate among males and females combined (443.2 per 100,000), driven by higher incidence of female breast cancer and melanoma, particularly among males.
- Overall cancer incidence rates among males were significantly lower in the Greater Bay Area than California (409.4 vs. 418.7 per 100,000). Among females,overall cancer incidence was similar between the two regions (377.0 vs. 380.4, respectively).
- In 2020 alone, approximately 31,200 new cases of invasive cancers were diagnosed. This is 11.4% less than the number of cases diagnosed in 2019 (35,271 cases).
Mortality, 2016-2020
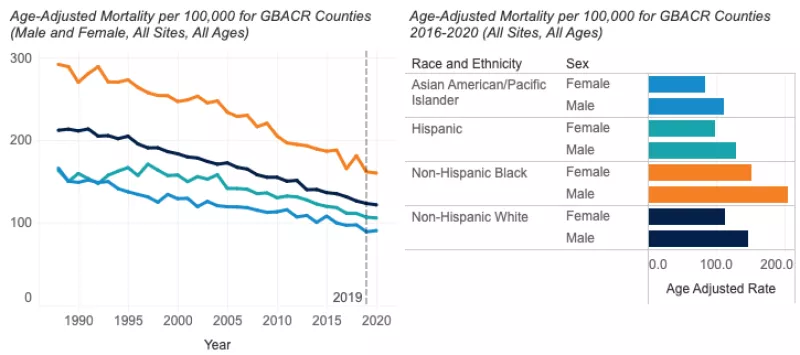
- The overall cancer mortality rate in the Greater Bay Area was highest among NH Black males (204.1 per 100,000) and females (151.1 per 100,000) compared to other racial and ethnic groups.
- AAPI males (110.8 per 100,000) and females (83.0 per 100,000) had the lowest mortality rates. These rates were approximately half the rates for NH Black males and females.
- From 2016 through 2020, the overall cancer mortality rate in the Greater Bay Area (139.1 per 100,000) was significantly lower than California (157.2 per 100,000) for both males and females.
- In 2020, approximately 10,200 cancer deaths occurred in Greater Bay Area residents.
Data Tables - All Cancer Sites
References
[1] Siegel, R. L., K. D. Miller, N. S. Wagle, and A. Jemal. "Cancer Statistics, 2023." CA Cancer J Clin 73, no. 1 (Jan 2023): 17-48. https://dx.doi.org/10.3322/caac.21763.
[2] Centers for Disease Control and Prevention [Internet]. Current Cigarette Smoking Among Adults in the United States; 2023 May 4. Available from: https://www.cdc.gov/tobacco/data_statistics/fact_sheets/adult_data/cig_smoking
Female Invasive Breast Cancer
Invasive breast cancer is the most common cancer in females, accounting for approximately a third of all invasive cancers diagnosed annually in the Greater Bay Area and in California. About one in eight females in the U.S. will develop invasive breast cancer within their lifetime. Risk factors include older age, family history of breast cancer, inherited genetic mutations (BRCA1 and BRCA2), early age of menarche, late age of menopause, no pregnancies or pregnancies later in life (i.e., first pregnancy after age 30), postmenopausal hormone therapy use, obesity and excessive weight gain, physical inactivity, alcohol consumption, and dense breast tissue (as indicated on a mammogram). However, risk factors differ across the different subtypes of breast cancer [1-4].
Incidence (1988-2019) and Mortality (1988-2020) Trends
- For females in the Greater Bay Area, breast cancer incidence has remained relatively stable since 1988, though racial and ethnic differences in trends persist.
- In AAPI females, rates have been increasing annually (1.2%), while remaining stable over time in all other groups. The underlying reasons for the increasing rate in this group are not well understood, with limited U.S. cancer epidemiologic cohort studies representative of this population.
- Mortality rates in females in the Greater Bay Area are generally declining, although the rates differ across racial and ethnic groups.
- The decline is highest among NH White females (-2.2%) followed by Hispanic (-1.9%), NH Black (-1.7%), and AAPI females (-1.0%).
Incidence - Invasive Breast Cancer in Females

Incidence Rates, 2016-2020
- The most recent 5-year incidence rates (2016-2020) show that compared to all other racial and ethnic groups, NH White females had the highest incidence rate of invasive breast cancer (144.2 per 100,000) followed by NH Black (124.0 per 100,000), AAPI (109.5) and Hispanic (98.0 per 100,000) females.
- Compared to California overall (137.8 per 100,000), NH White females in the Greater Bay Area had significantly higher incidence (144.2 per 100,000), while Hispanic, AAPI and NH Black female rates were similar to those of California.
- In the year 2020, 5,055 invasive breast cancers were diagnosed among Greater Bay Area females. This is down 15.6% from 2019 (5,991 cases).
Mortality - Invasive Breast Cancer in Females

Mortality Rates, 2016-2020
- The most recent mortality rates (2016-2020) show that NH Black females had the highest mortality rate (24.6 per 100,000), followed by NH White (18.5 per 100,000), Hispanic (13.3 per 100,000) and AAPI females (11.6 per 100,000).
- Compared to rates in California overall (18.7 per 100,000), breast cancer mortality among all racial and ethnic groups in the Greater Bay Area were significantly lower (16.2 per 100,000).
- In the year 2020, over 750 deaths occurred among Greater Bay Area female residents who had been diagnosed with breast cancer.
References
[1] National Cancer Institute. SEER Cancer Stat Facts: Female Breast Cancer. National Cancer Institute. Bethesda, MD, https://seer.cancer.gov/statfacts/html/breast.html
[2] Song, M. and E. Giovannucci, Preventable Incidence and Mortality of Carcinoma Associated With Lifestyle Factors Among White Adults in the United States. JAMA Oncol, 2016. 2(9): p. 1154-61.
[3] Sprague, B.L., et al., Proportion of invasive breast cancer attributable to risk factors modifiable after menopause. Am J Epidemiol, 2008. 168(4): p. 404-11.
[4] Tamimi, R.M., et al., Population Attributable Risk of Modifiable and Nonmodifiable Breast Cancer Risk Factors in Postmenopausal Breast Cancer. Am J Epidemiol, 2016. 184(12): p. 884-893.
[5] Engmann, N.J., et al., Population-Attributable Risk Proportion of Clinical Risk Factors for Breast Cancer. JAMA Oncol, 2017. 3(9): p. 1228-1236.
Prostate Cancer
Prostate cancer was the most diagnosed cancer among Greater Bay Area males in the years 1988 through 2020. Prostate cancer typically develops slowly, and males diagnosed with non-metastatic prostate cancer are more likely to die with the disease than of it. Risk factors include family history and increasing age. There is no single routine test that is recommended but options include digital rectal exam or prostate-specific antigen test (PSA) [1].
Prostate cancer incidence rates in the U.S. spiked in 1992 then steadily declined, a trend that has been attributed to the widespread adoption of PSA testing. [2] However, the incidence has increased by 2.7% per year from 2014 through 2019, with the greatest increase in incidence among people diagnosed with advanced stage disease. The lifetime risk of being diagnosed with prostate cancer is approximately 11.0% and prostate cancer death is 2.5% [3]. Currently, the U.S. Preventive Services Task Force recommends that men 70 years and older should not be screened for prostate cancer and that for men aged 55-69 should make an individual decision whether to be screened weighing the relative risks and benefits of early detection and treatment [3].
Incidence (1988-2019) and Mortality (1988-2020) Trends
- Incidence rates and trends have changed dramatically over time as screening guidelines have changed.
- During this entire period, overall, the prostate cancer incidence rate has declined for all racial and ethnic groups, with NH White and Hispanic males experiencing the largest annual decline (-0.7%) followed by NH Black (-0.5%), and AAPI males (-0.5%).
- Prostate cancer mortality rates have steadily declined by an average of -2.4% per year from 1988 through 2020, and declines were seen across all racial and ethnic groups.
- AAPI males experienced the greatest annual decline (-3.2%), followed by NH Black (-2.7%), NH White (-2.1%), and Hispanic males (-1.8%).
Incidence - Prostate Cancer

Incidence Rate, 2016-2020
- The most recent data (2016-2020) show that, compared to all other racial and ethnic groups, NH Black males had the highest incidence rate of prostate cancer (146.5 per 100,000), followed by NH White (101.1 per 100,000), Hispanic (81.6 per 100,000), and AAPI males (56.5 per 100,000). The high rate of prostate cancer among NH Black males is an active area of study.
- Prostate cancer incidence rates for 2016-2020 in the Greater Bay Area (93.8 per 100,000) are similar to those in California (96.8 per 100,000) for all racial and ethnic groups.
- In the year 2020, 3,920 prostate cancer cases were diagnosed among Greater Bay Area residents. This is down 10.1% from 2019 (4,360 cases).
Mortality - Prostate Cancer

Mortality Rate, 2016-2020
- NH Black males had the highest mortality rate (38.6 per 100,000), followed by NH White (18.5 per 100,000), Hispanic (17.9 per 100,000), and AAPI males (8.8 per 100,000).
- Prostate cancer mortality rates for 2016-2020 in the Greater Bay Area (16.9 per 100,000) were not significantly different from those in California (19.7 per 100,000) for all racial and ethnic groups.
- In the year 2020, 635 prostate cancer deaths occurred among males in the Greater Bay Area.
References
[1] PDQ® Screening and Prevention Editorial Board. PDQ Prostate Cancer Screening. Bethesda, MD: National Cancer Institute. Updated 05/06/2022. Available at: https://www.cancer.gov/types/prostate/patient/prostate-screening-pdq. [PMID: 26389306]
[2] Siegel, R., et al., Cancer Statistics, 2023. CA Cancer Journal, 2023. 73(1): p.17-48. Available at: https://acsjournals.onlinelibrary.wiley.com/doi/pdf/10.3322/caac.21763
[3] U. S. Preventive Services Task Force. Grossman, S. J. Curry, D. K. Owens, K. Bibbins-Domingo, A. B. Caughey, K. W. Davidson, C. A. Doubeni, M. Ebell, J. W. Epling, Jr., A. R. Kemper, A. H. Krist, M. Kubik, C. S. Landefeld, C. M. Mangione, M. Silverstein, M. A. Simon, A. L. Siu, and C. W. Tseng. "Screening for Prostate Cancer: US Preventive Services Task Force Recommendation Statement." JAMA 319, no. 18 (May 8 2018): 1901-13. https://dx.doi.org/10.1001/jama.2018.3710.
Lung and Bronchus Cancer
Smoking remains by far the leading risk factor for lung and bronchus cancer (hereafter lung cancer) [1]. In California, the prevalence of tobacco smoking continues to decline; in 1988, 23.7% of Californians smoked compared to 9.7% in 2018; a 41% decline in prevalence [2]. However, despite these declines, lung cancer remains the second-most common cancer among males (behind prostate) and females (behind breast) and the most common cause of cancer deaths in the Greater Bay Area, California, and nationwide [3].
Incidence (1988-2019) and Mortality (1988-2020) Trends
- From 1988-2019, incidence of lung cancer decreased significantly by an average of -2.9% per year among males and -1.4% per year among females
- Since 1988, the incidence of lung cancer has continued to decline in the Greater Bay Area among NH Black (-2.8%), NH White (-3.0%), Hispanic (-2.6%), and AAPI males (-1.7%).
- Since 1988, the incidence of lung cancer has remained stable for AAPI females (0.1%), but has decreased by approximately 1% annually among Hispanic, NH Black, and NH White females.
- Compared to California overall, the incidence and mortality rates of lung cancer among NH White males and females in the Greater Bay Area was lower. For all other racial and ethnic groups, Greater Bay Area rates were similar to California.
- Mortality trends of lung cancer were analogous to incidence trends. From 1988-2020, mortality decreased more significantly among males by an average of -3.7% per year compared to females (-2.6%).
- Declines in mortality were evident among all racial and ethnic groups, from -3.9% and -3.6% among NH White and NH Black males, respectively, to -1.3% among AAPI females.
Lung Cancer - Incidence

Incidence Rate, 2016-2020
- In 2016-2020, males had significantly higher incidence rates of lung cancer than females (39.1 compared to 34.0 per 100,000).
- NH Black males had the highest incidence rate of lung cancer (59.2 per 100,000), followed AAPI (41.6 per 100,000), NH White (38.7 per 100,000), and Hispanic males (27.5 per 100,000).
- NH Black females also had the highest rate (46.5 per 100,000), followed by NH White (37.8 per 100,000), AAPI (29.1 per 100,000), and Hispanic females (21.8 per 100,000).
- In the year 2020, there were 2,866 individuals in the Greater Bay Area diagnosed with lung cancer. This is down 10.8% from 2019 (3,212 cases).
Lung Cancer - Mortality

Mortality Rate, 2016-2020
- From 2016 through 2020, NH Black males and females had the highest lung cancer mortality rates (41.2 and 27.7 per 100,000, respectively).
- The lowest mortality rates were observed in Hispanic and AAPI females (12.0 and 15.8 per 100,000 respectively).
- In the year 2020, nearly 1,800 lung cancer deaths occurred in the Greater Bay Area.
References
[1] Lung Cancer Prevention (PDQ) : https://www.cancer.gov/types/lung/patient/lung-prevention-pdq
[2] California Department of Public Health, California Tobacco Control Program. California Tobacco Facts and Figures 2021. Sacramento, CA: California Department of Public Health; November 2021.
[3] American Cancer Society. Cancer Facts & Figures 2022. Atlanta: American Cancer Society; 2022.
Colorectal Cancer
Colorectal cancer was the fourth most common cancer diagnosed in the Greater Bay Area in the most recent years (2016-2020). Usually, these cancers develop when tissue in the inner surface of the colon or rectum starts to grow, forming a polyp [1]. Older age, obesity, smoking, history of colorectal polyps, alcohol consumption, and a diet high in red and processed meats are associated with increased risk of this cancer [1-3]. Adhering to colorectal cancer screening guidelines, engaging in regular physical activity, and a diet rich in whole grains and dairy products are associated with lower risk of colorectal cancer [3]. Colorectal cancer screening is important because it can identify polyps that could lead to in situ or invasive cancer, allowing for early intervention (removal of the polyp). The U.S. Preventive Services Task Force recommends screening for colorectal cancer in adults aged 45-75 years [4]. While incidence of colorectal cancer is decreasing overall, the incidence of colorectal cancer is increasing among people less than 50 years old throughout the U.S., including in California [5,6].
Incidence (1988-2019) and Mortality (1988-2020) Trends
- In the Greater Bay Area, colorectal cancer incidence rates have declined for all racial and ethnic groups since 1988.
- Incidence decreased by a similar amount in NH Black (-2.1% per year), NH White males and females (-1.9% per year), and AAPI males and females (-2.0% per year). A smaller average annual percent change was observed in Hispanic males and females (-1.4% per year).
- The mortality rate for males and females in the Greater Bay Area has declined among all racial and ethnic groups since 1988.
- Since 1988, Hispanic males and females have had the smallest reduction in colorectal cancer mortality compared to all other racial and ethnic groups (-1.6% per year). NH Whites males and females had the greatest reduction in mortality (-2.9% per year). AAPI males and females experienced a decrease of -2.5%, while mortality rates in NH Black males and females decreased by -2.3%.
Colorectal Cancer - Incidence

Incidence Rate, 2016-2020
- The most recent data (2016-2020) showed that NH Black males (42.7 per 100,000) and females (36.1 per 100,000) had the highest incidence rates of colorectal cancer followed by NH White males (36.8 per 100,000) and females (30.0 per 100,000), Hispanic males (35.5 per 100,000) and females (27.8 per 100,000) and AAPI males (32.4 per 100,000) and females (24.4 per 100,000).
- The incidence of colorectal cancer among males and females was slightly lower in the Greater Bay Area compared to California as a whole (males: 36.0 vs. 38.2 per 100,000, respectively; females: 28.8 vs. 30.1 per 100,000, respectively). In particular, AAPI males and females in the Greater Bay Area had a lower incidence rate of colorectal cancer compared to California overall (males: 32.4 vs. 35.0 per 100,000; females: 24.4 vs. 25.8 per 100,000).
- In the year 2020, approximately 2,574 cases of colorectal cancer were diagnosed among Greater Bay Area residents. This is down 9.0% from 2019 (2,828 cases).
Colorectal Cancer - Mortality

Mortality Rate, 2016-2020
- Mortality data for the most recent years (2016-2020) indicated that NH Black males (19.4 per 100,000) and females (13.6 per 100,000) had the highest colorectal cancer mortality rate. This was followed by Hispanic males (13.0 per 100,000) and females (8.4 per 100,000) and NH White males (12.1 per 100,000) and females (9.0 per 100,000). AAPI males (9.9 per 100,000) and females (7.4 per 100,000) had lower rates.
- From 2016 through 2020, colorectal cancer mortality rates in the Greater Bay Area for all racial or ethnic groups (12.1 for males and 8.9 for females per 100,000) were significantly lower than in California (14.1 for males and 10.2 for females per 100,000).
- AAPI and NH White males and females in the Greater Bay Area had significantly lower colorectal cancer mortality compared to California rates.
- Mortality rates for Hispanic and NH Black males and females were similar between the two regions.
- For AIAN males in the Greater Bay Area, rates were similar to California (23.4 and 25.5 per 100,000, respectively); however, for AIAN females, the mortality rate in the Greater Bay Area was twice as high as California (47.9 and 24.4 per 100,000, respectively).
- In the year 2020, about 900 colorectal cancer deaths occurred among Greater Bay Area males and females.
Data Tables - Colorectal Cancer
References
[1] National Cancer Institute, SEER Cancer Statistics Factsheets: Colon and Rectum. Available at: http://seer.cancer.gov/statfacts/html/colorect.html. U.S. Department of Health and Human Services, National Cancer Institute, Bethesda, MD.
[2] National Cancer Institute, Colon Cancer Treatment-Patient Version (PDQ). Available at: https://www.cancer.gov/types/colorectal/patient/colon-treatment-pdq#section/_112. U.S. Department of Health and Human Services, National Cancer Institute, Bethesda, MD.
[3] World Cancer Research Fund International, Colorectal Cancer. Available at: https://www.wcrf.org/diet-activity-and-cancer/cancer-types/colorectal-cancer/. Accessed on June 28, 2023. WCRF International, London.
[4] US Preventive Services Task Force Recommendation Statement. Screening for Colorectal Cancer: JAMA, 2021. 325(19): p. 1965-1977.
[5] Ellis, L., et al., Colorectal Cancer Incidence Trends by Age, Stage, and Racial/Ethnic Group in California, 1990-2014. Cancer Epidemiol Biomarkers Prev, 2018.
Uterine Cancer
Uterine cancer is the most common gynecologic cancer and is primarily diagnosed in post-menopausal females, with incidence peaking in the sixth decade of life [1]. In addition to age, other risk factors include obesity, estrogen-only hormone replacement therapy, and family history of uterine, colon, or ovarian cancer. Endometrial cancer (lining of the uterus) accounts for more than 90% of uterine cancers [1,2]. Rates and trends should be interpreted carefully due to the difficulty identifying true at-risk populations (females without hysterectomy), which may vary across time and racial and ethnic groups. For example, NH Black females experience higher hysterectomy rates in the U.S., partly due to higher prevalence of uterine fibroids. [3] However, hysterectomy data is not available and thus not used in these calculations.
Incidence (1988-2019) and Mortality (1988-2020) Trends
- Since 1988, across all racial and ethnic groups, incidence rates increased with a similar rise in mortality rates.
- From 1988 to 2019, there were significant annual increases in incidence among NH Black (2.3%) and AAPI (1.8%) females.
- Mortality rates significantly increased (0.8%) every year for all racial and ethnic groups from 1988-2020.
Uterine Cancer - Incidence

Incidence Rate, 2016-2020
- NH Black females (31.7 per 100,000) have higher incidence of uterine cancer compared to other racial and ethnic groups. Incidence for NH White females was 27.8 per 100,000, followed by Hispanic (25.4 per 100,000) and AAPI females (23.2 per 100,000).
- California and Greater Bay Area females experienced similar incidence rates for uterine cancer across all racial and ethnic groups (27.3 vs. 27.1 per 100,000) from 2016-2020.
- In 2020, 1,222 cases of uterine cancer were diagnosed among Greater Bay Area female residents. This is down 8.3% from 2019 (1332 cases).
Uterine Cancer - Mortality

According to California Department of Public Health guidelines, cancer incidence rates cannot be reported if based on less than 15 cancer cases and/or a population of less than 10,000 to ensure confidentiality and stable statistical rates.
Mortality Rate, 2016-2020
- In 2016-2020, mortality rates for NH Black females (11.1 per 100,000) were more than twice as high as Hispanic (5.1 per 100,000), followed by NH White (5.0 per 100,000), and AAPI (4.2 per 100,000) females. The higher mortality rates among NH Black women are attributed to their tumors being of more aggressive subtypes and more advanced stage at diagnosis [4].
- Greater Bay Area and California mortality rates (5.2 per 100,000 and 5.2 per 100,000, respectively) were similar across all racial and ethnic groups.
- In 2020, 247 deaths due to uterine cancer occurred among Greater Bay Area residents.
References
[1] Centers for Disease Control and Prevention. What Are the Risk Factors for Uterine Cancer?; 20203 Jun 14. Available from: https://www.cdc.gov/cancer/uterine/basic_info/risk_factors.htm
[2] Cancer.Net. Uterine Cancer - Statistics; 2023 Mar. Available from: https://www.cancer.net/cancer-types/uterine-cancer/statistics
[3] Temkin, Sarah M et al. “The End of the Hysterectomy Epidemic and Endometrial Cancer Incidence: What Are the Unintended Consequences of Declining Hysterectomy Rates?.” Frontiers in oncology vol. 6 89. 14 Apr. 2016, doi:10.3389/fonc.2016.00089
[4] Long, B., F.W. Liu, and R.E. Bristow, Disparities in uterine cancer epidemiology, treatment, and survival among African Americans in the United States. Gynecol Oncol, 2013. 130(3): p. 652-9
Invasive Melanoma
Invasive melanoma, a cancer of the skin’s pigment cells, is substantially more common among populations with fair complexions and prolonged exposure to sunlight. Melanoma is not exclusive to NH Whites, however. It is substantially more common among NH White males than NH White females. In the Greater Bay Area, among NH White males, melanoma was the second most common newly diagnosed invasive cancer. Compared to other types of skin cancers, melanoma is more likely to spread to other parts of the body [1].
Incidence (1988-2019) and Mortality (1988-2020) Trends
- While melanoma mortality rates have been decreasing since 1988 in the Greater Bay Area, incidence rates have been increasing.
- Since 1988, there has been a steep annual increase in the number of newly diagnosed cases per 100,000 each year for the NH White population, and an increase among males overall.
- Among the NH White population, the incidence of invasive melanoma increased at a rate of 2.9% per year from 1988 through 2019. The increase was larger for NH White males (3.1%) compared to females (2.6%).
- In general, among males overall, invasive melanoma incidence increased 2.2% per year from 1988 through 2019. Among females, incidence increased 1.6% per year.
- From 1988 through 2020, mortality due to invasive melanoma has been generally decreasing for the overall population. This decrease became steep and significant starting around 2008, likely due to advancements in therapies [2].
- Among males overall, the mortality rate decreased by 5.5% per year from 2010 through 2020. Among females overall, the mortality rate decreased by 4.4% from 2008 through 2020.
Melanoma - Incidence

According to California Department of Public Health guidelines, cancer incidence rates cannot be reported if based on less than 15 cancer cases and/or a population of less than 10,000 to ensure confidentiality and stable statistical rates.
Incidence Rate, 2016-2020
- In 2016-2020, among all racial and ethnic groups, the highest melanoma incidence rates were observed in the NH White population (males: 57.6 per 100,000; females: 36.6 per 100,000), and the lowest in the AAPI population (males: 1.1 per 100,000; females: 1.2 per 100,000).
- Based on 2016-2020 incidence rates, the Hispanic population in the Greater Bay Area (6.3 per 100,000) had significantly higher incidence than in all of California (4.8 per 100,000). The NH White population in the Greater Bay Area (45.8 per 100,000) also had significantly higher incidence than in all of California (37.9 per 100,000).
- In the year 2020, 1,875 cases of melanoma were diagnosed among Greater Bay Area residents. Among those, over 1,500 were among NH White residents. Melanoma cases reported in 2020 are down 23.7% from 2019 (2,456 cases).
Melanoma - Mortality

According to California Department of Public Health guidelines, cancer incidence rates cannot be reported if based on less than 15 cancer cases and/or a population of less than 10,000 to ensure confidentiality and stable statistical rates.
Mortality Rate, 2016-2020
- The mortality rate was over twice as high among males (2.4 per 100,000) than females (1.0 per 100,000).
- Among NH Whites, mortality was more than twice as high in males (4.0 per 100,000) than females (1.5 per 100,000).
- The most recent melanoma mortality rate over 2016-2020 in the Greater Bay Area (1.6 per 100,000) was comparable to those in California (1.8 per 100,000) for the overall population (males and females among all racial and ethnic groups).
- In 2020, just over 120 deaths due to melanoma occurred among Greater Bay Area residents. Among those, almost 100 were among the NH White residents.
References
[1] National Cancer Institute, Melanoma Treatment (PDQ®)–Patient Version. Available at: https://www.cancer.gov/types/skin/patient/melanoma-treatment-pdq. U.S. Department of Health and Human Services, National Cancer Institute, Bethesda, MD.
[2] Berk-Krauss J, Stein JA, Weber J, Polsky D, Geller AC. New Systematic Therapies and Trends in Cutaneous Melanoma Deaths Among US Whites, 1986-2016. Am J Public Health. 2020;110(5):731-3.
Non-Hodgkin Lymphoma
Non-Hodgkin Lymphoma is a cancer that starts in cells called lymphocytes, which are part of the body’s immune system. Lymphomas can start anywhere that lymph tissue is found, such as lymph nodes, the spleen, bone marrow, and the tonsils [1]. Lymphomas can be indolent, meaning the cancer does not need immediate treatment but should be monitored closely. They can also be aggressive, requiring immediate treatment due to their ability to grow and spread quickly. Factors affecting an individual’s risk of developing Non-Hodgkin Lymphoma include immune disorders, infections, genetics, race and ethnicity, family history, and occupational factors [2,3].
Incidence (1988-2019) and Mortality (1988-2020) Trends
- Since 1988, across all racial and ethnic groups, incidence rates increased significantly for females, while mortality rates decreased for both males and females.
- There was a significant annual increase in incidence among NH Black females (1.1%) and NH White females (0.6%), while there was a significant annual decrease in incidence among NH White males (-0.4%).
- Mortality rates decreased for all racial and ethnic groups from 1988-2019, with NH White males and females experiencing the highest decrease (-1.9%), followed by AAPI (-1.6%), and Hispanic (-0.7%) males and females.
Non-Hodgkin Lymphoma - Incidence

Incidence Rate, 2016-2020
- The most recent data (2016-2020) showed that Non-Hodgkin Lymphoma incidence rates were higher among males than females overall (24.0 vs. 16.1 per 100,000). This pattern was observed across all racial and ethnic groups.
- Incidence rates for 2016-2020 showed that NH White males (27.2 per 100,000) had significantly higher incidence rates than Hispanic (23.0 per 100,000), NH Black (20.1 per 100,000), and AAPI (17.9 per 100,000) males.
- NH White and Hispanic females had similarly high rates (17.5 and 17.1 per 100,000, respectively); these rates were significantly higher than rates among AAPI (12.3 per 100,000) and NH Black (12.8 per 100,000) females.
- In the year 2020, 1,645 Non-Hodgkin Lymphoma cases were diagnosed among Greater Bay Area residents. This is down 6.2% from 2019 (1,753 cases).
Non-Hodgkin Lymphoma - Mortality

Mortality Rate, 2016-2020
- Mortality data for the most recent years (2016-2020) indicated that NH White males had the highest rate (6.5 per 100,000) and AAPI females had the lowest rate (3.0 per 100,000).
- Mortality rate in males of all racial and ethnic groups (6.1 per 100,000) was nearly double the mortality rate of females of all racial and ethnic groups (3.5 per 100,000).
- In the year 2020, over 377 deaths from Non-Hodgkin Lymphoma occurred among Greater Bay Area residents.
Data Tables - Non-Hodgkin Lymphoma
References
[1] American Cancer Society, Non-Hodgkin Lymphoma. 2018: Available at: https://www.cancer.org/cancer/types/non-hodgkin-lymphoma/about/what-is-non-hodgkin-lymphoma.html
[2] SEER Cancer Stat Facts: Non-Hodgkin Lymphoma. National Cancer Institute. Bethesda, MD, https://seer.cancer.gov/statfacts/html/nhl.html
[3] Armitage, J.O., et al., Non-Hodgkin lymphoma. Lancet, 2017. 390(10091): p. 298-310.
Bladder Cancer
Bladder cancer is the eighth most common cancer and four times more prevalent among males than females. Approximately 90% of cases occur in those ages 55 and over. NH White males and females are more likely to be diagnosed with bladder cancer than any other racial and ethnic group. The largest risk factor for bladder cancer is smoking tobacco, which contributes to 50-65% of all cases; up to another 20% of bladder cancer can be attributed to exposure to chemicals in textile, rubber, leather, and print industries [1].
Incidence (1988-2019) and Mortality (1988-2020) Trends
- Hispanic (-0.8%), Asian American/Pacific Islander (-0.4%), and NH White (-0.3%) males and females experienced significant annual decreases in incidence. There was no significant increase or decrease in incidence among NH Black males and females.
- Male and females of all racial and ethnic groups combined experienced an annual decline in mortality rates in 1988-2020 (-0.8%).
Bladder Cancer - Incidence

Incidence Rate, 2016-2020
- The incidence rate in males of all racial and ethnic groups combined (27.3 per 100,000) was more than four times higher than females (6.3 per 100,000).
- NH White males (35.5 per 100,000) and females (8.3 per 100,000) had the highest incidence rates, followed by NH Black males (20.8 per 100,000) and females (5.3 per 100,000), Hispanic males (17.8 per 100,000) and females (4.6 per 100,000), and AAPI males (15.3 per 100,000) and females (5.3 per 100,000).
- Greater Bay Area and California residents had similar overall incidence rates (15.6 vs. 15.9 per 100,000, respectively).
- In 2020, 1,321 bladder cancer cases were diagnosed in the Greater Bay Area. This is down 2.6% from 2019 (1,356 cases).
Bladder - Mortality

According to California Department of Public Health guidelines, cancer incidence rates cannot be reported if based on less than 15 cancer cases and/or a population of less than 10,000 to ensure confidentiality and stable statistical rates.
Mortality Rate, 2016-2020
- Mortality among males (5.3 per 100,000) was more than three times higher than females (1.6 per 100,000).
- NH White males (6.9 per 100,000) and females (2.0 per 100,000) had the highest mortality rates. This is followed by NH Black males (6.1 per 100,000) and females (1.8 per 100,000), Hispanic males (3.3 per 100,000) and females (1.5 per 100,000) and AAPI males (2.6 per 100,000) and females (0.9 per 100,000).
- Greater Bay residents had lower mortality rates for both males and females (3.2 per 100,000) compared to the California mortality rates (3.8 per 100,000).
- In 2020, 283 bladder cancer deaths occurred in Greater Bay Area residents.
References
[1] Saginala, K., Barsouk, A., Aluru, J. S., Rawla, P., Padala, S. A., & Barsouk, A. (2020). Epidemiology of Bladder Cancer. Medical Sciences, 8(1), 15. https://doi.org/10.3390/medsci8010015
Kidney Cancer
Kidney cancer is one of the top ten most common cancers in the U.S. and is about twice as common in males than females [1]. Established risk factors for kidney cancer include tobacco smoking, obesity, and history of hypertension and chronic kidney disease [2]. The majority of kidney cancers (between 60-70%) are diagnosed before cancer has spread outside the kidney (localized stage), and the observed incidence trends are driven by the trends in localized disease [3,4]. Increasing rates can in part be attributed to the greater use of medical imaging procedures resulting in incidental detection of early kidney cancers. They may also reflect changes in the prevalence of kidney cancer risk factors, such as obesity and hypertension, in the population [4].
Incidence (1988-2019) and Mortality (1988-2020) Trends
- In the Greater Bay Area, kidney cancer incidence rates have been increasing similarly among males (1.1%) and females (1.2%). The largest annual increases occurred in NH Black (2.6%) and AAPI (2.4%) males and females, followed by Hispanic (1.9%) and NH White (1.1%) males and females.
- Over the period of 1988-2020, the mortality rate in the Greater Bay Area has been declining at -1.3% annually in males and females, across all races. The annual decline in mortality rates was somewhat larger in females (-1.4%) than in males (-1.1%).
Kidney Cancer - Incidence

Incidence Rate, 2016-2020
- In the Greater Bay Area, the most recent incidence rates (2016-2020) showed that, compared to all other racial and ethnic groups, NH Black males and females (19.2 per 100,000) had the highest incidence of kidney cancer, followed by Hispanic (16.0 per 100,000), AIAN (14.1 per 100,000), NH White (13.7 per 100,000), and AAPI (8.3 per 100,000) males and females.
- Males had substantially higher incidence rates than females (18.4 vs. 8.5 per 100,000 correspondingly).
- In the Greater Bay Area, the incidence rates of kidney cancer were lower than in California for both males (18.4 vs. 20.5 per 100,000) and females (8.5 vs. 10.3 per 100,000). This trend was largely driven by regional differences in incidence among NH White and Hispanic populations.
- In 2020, 1,168 kidney cancer cases were diagnosed in the Greater Bay Area. This is down 8.6% from 2019 (1,068 cases).
Kidney Cancer - Mortality

According to California Department of Public Health guidelines, cancer incidence rates cannot be reported if based on less than 15 cancer cases and/or a population of less than 10,000 to ensure confidentiality and stable statistical rates.
Mortality Rate, 2016-2020
- Mortality data for the most recent years (2016-2020) indicated that NH Black males and females had the highest rate (3.5 per 100,000), followed closely by Hispanic (3.2 per 100,000), NH White (2.7 per 100,000), and AAPI (1.7 per 100,000) males and females.
- Mortality rates were higher among males than females (3.8 vs. 1.6 per 100,000, respectively).
- For 2016 through 2020, kidney cancer mortality rates in the Greater Bay Area were lower than in California for both males (3.8 vs. 4.7 per 100,000) and females (1.6 vs. 2.0 per 100,000).
- In the year 2020, 160 kidney cancer deaths occurred among Greater Bay Area males, including 73 kidney cancer deaths among females.
References
[1] ACS Report: https://www.cancer.org/cancer/kidney-cancer/about/key-statistics.html
[2] Scelo G, Larose TL. Epidemiology and Risk Factors for Kidney Cancer. J Clin Oncol. 2018 Oct 29;36(36):JCO2018791905. doi: 10.1200/JCO.2018.79.1905.
[3] Kase AM, George DJ, Ramalingam S. Clear Cell Renal Cell Carcinoma: From Biology to Treatment. Cancers (Basel). 2023 Jan 21;15(3):665. doi: 10.3390/cancers15030665.
[4] Rossi, S. H., Klatte, T., Usher-Smith, J., & Stewart, G. D. (2018). Epidemiology and screening for renal cancer. World journal of urology, 36(9), 1341-1353.
Thyroid Cancer
Thyroid cancer incidence increased dramatically in the Greater Bay Area starting in the early 2000s but has stabilized since approximately 2010. Increases in thyroid cancer may be due to improved imaging technology and thus increased detection of thyroid cancers, as well as to the increased prevalence of suspected risk factors (e.g., prior radiation exposure, obesity, insulin resistance due to obesity or type 2 diabetes) [1,2]. There has been substantial scientific discourse as to whether the increase in papillary thyroid cancer diagnoses represents “overdiagnosis” of a harmless condition, and questions about potential over-treatment of otherwise indolent cancers [3].
Incidence (1988-2019) and Mortality (1988-2020) Trends
- Since 1988, the incidence of thyroid cancer has increased by an average of 2-3% per year for all racial and ethnic groups. The average annual increase was similar for females (3.0%) and males (2.8%). After increasing, incidence has stabilized since approximately 2010 for NH White males and females. However, rates for AAPI and Hispanic males and females are continuing to increase.
- Mortality is low and has remained stable since 1988 for both sexes and all racial and ethnic groups.
Thyroid Cancer - Incidence

According to California Department of Public Health guidelines, cancer incidence rates cannot be reported if based on less than 15 cancer cases and/or a population of less than 10,000 to ensure confidentiality and stable statistical rates.
Incidence Rate, 2015-2019
- From 2016 through 2020, incidence rates are strikingly higher among females than males, with incidence rates approximately two to three times higher for females than males for each racial and ethnic group.
- For the AAPI population, the incidence among males compared to females was 6.4 vs. 19.3 per 100,000. Incidence rates for AAPI females were significantly higher than NH White and NH Black females.
- For the Hispanic population, the incidence among males compared to females was 5.4 vs. 18.1 per 100,000.
- For the NH Black population, the incidence among males compared to females was 3.8 vs. 8.2 per 100,000. Incidence rates for NH Black females were significantly lower than females of all other racial and ethnic groups.
- For the NH White population, the incidence among males compared to females was 7.9 vs. 16.9 per 100,000.
- In 2020, 818 thyroid cancer cases were diagnosed in the Greater Bay Area. This is down 23.3% from 2019 (1,067 cases).
Thyroid Cancer - Mortality

According to California Department of Public Health guidelines, cancer incidence rates cannot be reported if based on less than 15 cancer cases and/or a population of less than 10,000 to ensure confidentiality and stable statistical rates.
Mortality Rate, 2016-2020
- Thyroid cancer mortality is low (0.6 per 100,000 for all races and ethnicities combined). The most recent data (2016-2020) showed AAPI females (0.9 per 100,000) had mortality rates that were significantly higher than AAPI males (0.4 per 100,000) and NH White females (0.4 per 100,000).
- In the year 2020, 44 thyroid cancer deaths occurred among Greater Bay Area residents.
References
[1] Horn-Ross, P.L., et al., Continued rapid increase in thyroid cancer incidence in California: trends by patient, tumor, and neighborhood characteristics. Cancer Epidemiol Biomarkers Prev, 2014. 23(6): p. 1067-79.
[2] Pellegriti, G., et al., Worldwide increasing incidence of thyroid cancer: update on epidemiology and risk factors. J Cancer Epidemiol, 2013.
[3] Vaccarella, S., et al., The Impact of Diagnostic Changes on the Rise in Thyroid Cancer Incidence: A Population-Based Study in Selected High-Resource Countries. Thyroid, 2015. 25(10): p. 1127-36.
Pancreatic Cancer
Pancreatic cancer is the 11th most common cancer and one of the leading causes of cancer incidence and the 5th most common cause of cancer mortality, in the Greater Bay Area. This type of cancer is often detected at a later stage due to its rapid spread and the lack of symptoms in the early stages. Later stages are associated with symptoms, but these can be non-specific, such as lack of appetite and weight loss [1]. Smoking, obesity, personal or family history of diabetes or pancreatitis, occupational exposure to some chemicals, and certain hereditary conditions have been associated with risk of pancreatic cancer. Pancreatic adenocarcinoma is the most common type of pancreatic cancer, accounting for approximately 85% of pancreatic cancers. [2]
Incidence (1988-2019) and Mortality (1988-2020) Trends
- Since 1988, the incidence of pancreatic cancer has increased, on average, 0.3% per year among females in the Greater Bay Area. The incidence rate among men overall has been stable.
- On average, since 1988, pancreatic cancer has increased annually in AAPI females by 0.9% and NH White females by 0.3%. The incidence rate among NH White males has increased 0.7% per year on average.
- Mortality rates have decreased among males and females in the Greater Bay Area, on average, since 1988 (-0.5% and -0.3% per year, respectively).
- NH Black males have seen the largest decline in mortality (-1.9% per year); no other racial or ethnic group had a statistically significant change in mortality rate during this time frame.
Pancreatic Cancer - Incidence

Incidence Rate, 2016-2020
- Compared to all other racial and ethnic groups, the most recent incidence rates showed that NH Black males (16.4 per 100,000) and females (17.0 per 100,000) had the highest incidence rates of pancreatic cancer compared to other racial and ethnic groups. These were followed by NH White males (14.4 per 100,000) and females (11.2 per 100,000), and Hispanic males (13.3 per 100,000) and females (10.6 per 100,000). AAPI males (11.1 per 100,000) and females (9.1 per 100,000) had the lowest incidence.
- In 2020, 1,085 pancreatic cancer cases were diagnosed in the Greater Bay Area. This is down 5.8% from 2019 (1,033 cases).
Pancreatic Cancer - Mortality

Mortality, 2016-2020
- NH Black populations had the highest mortality rate of pancreatic cancer, with similar mortality rates among males (13.3 per 100,000) and females (13.7 per 100,000). AAPI males and females had the lowest mortality rate (7.7 per 100,000).
- In the year 2020, about 850 pancreatic cancer deaths occurred among Greater Bay Area residents.
Data Tables - Pancreatic Cancer
References
[1] National Cancer Institute, SEER Cancer Statistics Fact Sheets: Pancreatic Cancer. Available at: http://seer.cancer.gov/statfacts/html/pancreas.html. U.S. Department of Health and Human Services, National Cancer Institute, Bethesda, MD.
[2] Ilic, M. and I. Ilic, Epidemiology of pancreatic cancer. World J Gastroenterol, 2016. 22(44): p. 9694-9705.
Leukemia
Although leukemia is the most common type of childhood cancer, it occurs most often in adults older than 55 years [1]. It is more common in males than females. A variety of treatment options can help control the progression of leukemia and its symptoms; these include traditional chemotherapy, targeted therapies towards genes and proteins identified in leukemia cells, radiation, and stem cell/bone marrow transplant. Leukemia is the ninth leading cause of cancer death in the U.S. with a national 5-year relative survival rate of 65.7%. Both incidence and mortality rates vary by age, race and ethnicity.
Incidence (1988-2019) and Mortality (1988-2020) Trends
- From the 1988-2019, leukemia incidence rates remained stable among males and females of all racial and ethnic groups.
- Annual mortality rates among males and females across all racial and ethnic groups decreased by -1.7% during 1988-2020, with larger declines since 2014 (-4.4%).
Leukemia - Incidence

Incidence Rate, 2016-2020
- In 2016-2020, Greater Bay Area leukemia incidence rates for males were higher than females, across all racial and ethnic groups.
- The incidence rate among AAPI males was 10.4 per 100,000 vs. 5.8 per 100,000 for AAPI females.
- Hispanic male incidence rate was 11.2 per 100,000 vs. 8.7 per 100,000 for Hispanic females.
- NH Black male incidence rate was 12.9 per 100,000 vs. 8.5 per 100,000 for NH Black females.
- NH White male incidence rate was 17.7 per 100,000 vs. 9.9 per 100,000 for NH White females; NH White males had the highest incidence rate across groups defined by sex, race and ethnicity.
- The overall incidence rate among males and females was lower in the Greater Bay Area (11.6 per 100,000) than California overall (12.5 per 100,000).
- In the year 2020, 875 cases of leukemia were diagnosed among Greater Bay Area residents. This is down 10.1% from 2019 (973 cases)
Leukemia - Mortality

Mortality Rate, 2016-2020
- In 2016-2020, the leukemia mortality rate was highest among NH White males (7.6 per 100,000), followed by NH Black males (7.0 per 100,000), then AAPI and Hispanic males (both 5.0 per 100,000).
- In 2016-2020, leukemia mortality rates for all racial and ethnic groups combined were 6.6 per 100,000 males and 3.4 per 100,000 females, which were lower than corresponding California statewide rates.
- In the year 2020, about 350 leukemia deaths occurred among Greater Bay Area residents.
Reference
[1] National Cancer Institute, Cancer Stat Facts: Leukemia. Available at: https://seer.cancer.gov/statfacts/html/leuks.html. U.S. Department of Health and Human Services, National Cancer Institute, Bethesda, MD.
Ovarian Cancer
Most ovarian cancers start from cells that cover the outer surface of the ovaries and are often not diagnosed until late stage [1]. Risk factors include a family history of ovarian cancer, obesity and excessive weight gain, no history of pregnancy, use of postmenopausal hormone therapy, and use of fertility treatments [2,3].
Incidence (1988-2019) and Mortality (1988-2020) Trends
- Ovarian cancer incidence has declined in all racial and ethnic groups in the Greater Bay Area since 1988. The largest annual decline occurred among NH White females (-1.4%), followed by Hispanic females (-1.3%), NH Black females (-0.8%), and AAPI females (-0.6%).
- Mortality declined significantly for all females in the Greater Bay Area through 2020 (-1.7%).
Ovarian Cancer - Incidence

Incidence Rate, 2016-2020
- The most recent incidence rates showed that NH White females had the highest incidence of ovarian cancer (10.9 per 100,000), followed by NH Black females (9.4 per 100,000), AAPI females (9.2 per 100,000) and Hispanic females (9.1 per 100,000).
- Compared to California overall (10.6 per 100,000), Greater Bay Area incidence of ovarian cancer was similar (10.2 per 100,000) for females of all racial and ethnic groups.
- In the year 2020, 472 ovarian cancers were diagnosed among Greater Bay Area residents. This is down 4.0% from 2019 (453 cases).
Ovarian Cancer - Mortality

According to California Department of Public Health guidelines, cancer incidence rates cannot be reported if based on less than 15 cancer cases and/or a population of less than 10,000 to ensure confidentiality and stable statistical rates.
Mortality Rate, 2016-2020
- NH White females had the highest mortality rate of ovarian cancer (6.8 per 100,000), followed by NH Black females (6.1 per 100,000), Hispanic females (4.9 per 100,000) and AAPI females (4.2 per 100,000).
- Compared to California overall (5.9 per 100,000), Hispanic women in the Greater Bay Area had a lower mortality rate of ovarian cancer (4.4 per 100,000). All other racial and ethnic groups had rates that were similar to California ovarian cancer mortality rates.
- In the year 2020, 268 ovarian cancer deaths occurred among Greater Bay Area residents.
References
[1] American Cancer Society, Ovarian Cancer: Detailed Guide. 2018: Available at: http://www.cancer.org/cancer/ovarian-cancer/about/what-is-ovarian-cancer.html.
[2] National Cancer Institute, Ovarian, Fallopian Tube, and Primary Peritoneal Cancer Prevention–for health professionals (PDQ®). 2023. Available at: http://www.cancer.gov/types/ovarian/hp/ovarian-prevention-pdq. U.S. Department of Health and Human Services, National Cancer Institute, Bethesda, MD.
[3] Woolen SA, Lazar AA, Smith-Bindman R. Association Between the Frequent Use of Perineal Talcum Powder Products and Ovarian Cancer: a Systematic Review and Meta-analysis. J Gen Intern Med. Published online February 2, 2022. doi:10.1007/s11606-022-07414-7.
Oropharyngeal Cancer
Cancer of the oral cavity and pharynx (oropharyngeal cancer) is more common in males than females [1]. The main risk factor, responsible for approximately 70% of oropharyngeal cancers, is infection with certain strains of human papillomavirus (HPV) [2]. Other important risk factors are tobacco and heavy alcohol use. There is no routine screening in place, but HPV vaccination has been shown effective against oral HPV infection and is indicated for oropharyngeal cancer prevention [3,4,5].
Incidence (1988-2019) and Mortality (1988-2020) Trends
- For all males, oropharyngeal cancer declined annually since 1988 by an average of -0.8%. A larger decline occurred among all females during this time (-1.3%).
- For males and females collectively, the largest average annual declines were among NH Black (-1.9%) and Hispanic (-1.6%) populations.
- Over the period of 1988-2020, similar annual declines in mortality occurred for males (-1.8%) and females (-2.0%).
Oropharyngeal Cancer - Incidence

Incidence Rate, 2016-2020
- The most recent incidence rates (2016-2020) for males showed that, compared to other racial and ethnic groups, NH White males had the highest incidence rate of oropharyngeal cancer (18.0 per 100,000) and Hispanic males had the lowest incidence rate (9.0 per 100,000). This may be due to racial and ethnic differences in prevalence of oncogenic oral HPV types and sexual behaviors [6,7].
- Among females, NH White (6.4 per 100,000) and AAPI (6.3 per 100,000) populations had the highest incidence rates of oropharyngeal cancer. The lowest incidence rate was observed in Hispanic females (3.9 per 100,000).
- The incidence rate for AAPI females was significantly higher in the Greater Bay Area (6.3 per 100,000) compared to California overall (5.3 per 100,000). For males, the incidence rate was also significantly higher in the Greater Bay Area (11.7 per 100,000) compared to California overall (10.5 per 100,000) for AAPI males, but lower for NH White males (18.0 vs. 19.9 per 100,000).
- In the year 2020, 874 oropharyngeal cancers were diagnosed among Greater Bay Area residents. This is down 2.3% from 2019 (895 cases).
Oropharyngeal Cancer - Mortality

According to California Department of Public Health guidelines, cancer incidence rates cannot be reported if based on less than 15 cancer cases and/or a population of less than 10,000 to ensure confidentiality and stable statistical rates.
Mortality Rates, 2016-2020
- In recent years (2016-2020), NH Black and NH White males had the highest mortality rates (4.1 and 3.7 respectively per 100,000) when compared to other racial and ethnic groups, while Hispanic males had the lowest rate (2.1 per 100,000). Oropharyngeal cancer mortality rates among females were similar across racial and ethnic groups and averaged at 1.2 per 100,000.
- Mortality rates were similar between the Greater Bay Area and California overall for all racial and ethnic groups except for NH White males and females, where California shows a higher mortality rate (4.4 per 100,000 in males and 1.4 per 100,000 in females) compared to the Greater Bay Area (3.7 per 100,000 in males and 1.1 per 100,000 in females).
- In the year 2020, 156 oropharyngeal cancers deaths occurred among Greater Bay Area males, including just over 70 deaths among females.
Data Tables - Oropharyngeal Cancer
References
[1] American Cancer Society, Oral Cavity and Oropharyngeal Cancers. Detailed Guide. Available at: https://www.cancer.org/cancer/types/oral-cavity-and-oropharyngeal-cancer/causes-risks-prevention/risk-factors.html. 2023
[2] Centers for Disease Control and Prevention. Cancers Associated with Human Papillomavirus, United States, 2014–2018. United States Cancer Statistics Data Brief 2021;26.
[3] Herrero R, Quint W, Hildesheim A, Gonzalez P, Struijk L, Katki HA, Porras C, Schiffman M, Rodriguez AC, Solomon D, Jimenez S, Schiller JT, Lowy DR, van Doorn LJ, Wacholder S, Kreimer AR; CVT Vaccine Group. Reduced prevalence of oral human papillomavirus (HPV) 4 years after bivalent HPV vaccination in a randomized clinical trial in Costa Rica. PLoS One. 2013 Jul 17;8(7):e68329. doi: 10.1371/journal.pone.0068329
[4] Macilwraith P, Malsem E, Dushyanthen S. The effectiveness of HPV vaccination on the incidence of oropharyngeal cancers in men: a review. Infect Agent Cancer. 2023 Apr 24;18(1):24. doi: 10.1186/s13027-022-00479-3.
[5] Food and Drug Administration, Product approval information for Human Papillomavirus 9-valent Vaccine, Recombinant also known as Gardasil 9, 2020. Available at: https://www.fda.gov/vaccines-blood-biologics/vaccines/gardasil-9
[6] Raymond S, Liu B, Taioli E. Racial differences in the prevalence of oncogenic oral human papillomavirus infection types in the United States adult population. Head Neck. 2018 Oct;40(10):2219-2227. doi: 10.1002/hed.25317
[7] Wierzbicka M, Klussmann JP, San Giorgi MR, Wuerdemann N, Dikkers FG. Oral and laryngeal HPV infection: Incidence, prevalence and risk factors, with special regard to concurrent infection in head, neck and genitals. Vaccine. 2021 Apr 22;39(17):2344-2350. doi: 10.1016/j.vaccine.2021.03.047.
Liver and Intrahepatic Bile Duct Cancer
Hepatocellular carcinoma (HCC) is the most common type of liver cancer in adults [1]. Bile duct cancer (cholangiocarcinoma) is a rare cancer that forms inside the bile ducts of the liver, which are tubes that connect the liver and gallbladder to the small intestine. Cancer that forms in the bile ducts is called intrahepatic bile duct cancer (IBD).
This section includes data for liver cancer and IBD combined. Liver cancer and IBD is approximately three times more common in males than females. Risk factors for liver cancer include chronic hepatitis B infection, chronic hepatitis C infection, heavy alcohol use, and obesity [2]. Five-year relative survival from liver cancer is 21.6%, with worse survival among those with later stage of diagnosis [3]. Screening for liver cancer is recommended for high-risk groups, such as those with chronic hepatitis B or C infections, and patients with cirrhosis.
Incidence (1988-2019) and Mortality (1988-2020) Trends
- In the Greater Bay Area, annual incidence of liver cancer and IBD increased similarly for males (2.1%) and females (2.4%) since 1988. However, there were differences across racial and ethnic groups.
- Incidence rates increased most for NH White females (3.0%) and Hispanic males (2.7%).
- NH Black males and females combined also experienced an annual increase in liver cancer incidence (2.5%).
- Liver cancer incidence decreased annually among AAPI males (-0.9%) and females (-0.7%).
- Changes in annual mortality rates of liver cancer and IBD since 1988 also varied across race and ethnicity.
- Mortality rates decreased significantly for AAPI males and females (-1.4%) combined.
- Mortality rates increased for NH White males (2.0%) and females (2.1%).
- Mortality rates remained stable for NH Black males and females combined (0.3%) during this time.
Liver and Intrahepatic Bile Duct Cancer - Incidence

Incidence Rate, 2016-2020
- During 2016-2020, Hispanic males has the highest incidence rate of liver cancer and IBD (21.1 per 100,000), NH Black males (19.5 per 100,000), and AAPI males (18.0 per 100,000). NH White males had the lowest liver cancer incidence rate (9.8 per 100,000).
- Hispanic females had the highest incidence rate (8.9 per 100,000) followed by AAPI females (6.4 per 100,000) and NH Black females (6.1 per 100,000). NH White females had the lowest rate (4.0 per 100,000).
- Incidence rates were higher for NH Black males in the Greater Bay Area (19.5 per 100,000) compared to California overall (16.0 per 100,000). All other racial and ethnic groups had incidence rates that were comparable to rates in California.
- In the year 2020, 769 liver and IBD cancers were diagnosed among Greater Bay Area residents. This is down 12.7% from 2019 (881 cases).
Liver and Intrahepatic Bile Duct Cancer - Mortality

Mortality Rate, 2016-2020
- In 2016-2020, NH Black males had the highest mortality rates of liver and IBD cancers (14.9 per 100,000). AAPI (12.9 per 100,000) and Hispanic (12.6 per 100,000) males had similar rates, while NH White males had the lowest rate (7.6 per 100,000).
- Among females, Hispanic females had the highest mortality rate (6.6 per 100,000), while NH Black (5.5 per 100,000) and AAPI (5.0 per 100,000) females had similar rates. Liver and IBD cancer mortality was lowest among NH White females (3.4 per 100,000).
- From 2016-2020, the mortality rate was lower for Hispanic males in the Greater Bay Area (12.6 per 100,000) compared to California overall (14.4 per 100,000). Other racial and ethnic groups had similar rates to those in California.
- In the year 2020, 624 liver cancer deaths occurred among Greater Bay Area residents.
References
[1] What is liver cancer? American Cancer Society. 2019. Available from: https://www.cancer.org/cancer/liver-cancer/about/what-is-liver-cancer.html
[2] National Cancer Institute. Liver Cancer Causes, Risk Factors, and Prevention; 2023 Jun 26. Available from: https://www.cancer.gov/types/liver/what-is-liver-cancer/causes-risk-factors
[3] SEER. Cancer of the Liver and Intrahepatic Bile Duct - Cancer Stat Facts. Available from: https://seer.cancer.gov/statfacts/html/livibd.html
Stomach Cancer
Stomach cancer, also known as gastric cancer, remains a leading cause of cancer and cancer-related mortality. It is ranked the 16th most common cancer in the Greater Bay Area. In most of the world, stomach cancers form in the main part of the stomach (noncardia), but in the U.S., stomach cancer is more likely to affect the area where the esophagus meets the stomach (cardia). Known risk factors include smoking, a diet high in smoked and salted foods, and medical conditions including H. pylori infection [1]. Globally, stomach cancer is much more common than in the U.S. [2].
Incidence (1988-2019) and Mortality (1988-2020) Trends
- Stomach cancer incidence rates declined significantly since 1988 for all racial and ethnic groups and both sexes. Overall, incidence declined more rapidly among males (-1.8%) than females (-0.8%).
- The steepest declines have been noted in the AAPI population (males: -2.5%; females: -2.1%), Hispanic males (-2.2%), and NH Black males (-2.5%).
- From 1988 through 2020, AAPI males experienced the largest decline in stomach cancer mortality (-3.6% per year). The NH White population experienced a similar decline in average annual mortality (males: -3.0%, female: -3.4%). The mortality rate for Hispanic males declined annually at a slower pace (-2.2%).
Stomach Cancer - Incidence

Incidence Rate, 2016-2020
- NH Black males (12.6 per 100,000) and Hispanic females (7.8 per 100,000) had the highest stomach cancer incidence rates. Incidence rates for stomach cancer were significantly lower for both NH White males (7.4 per 100,000) and females (3.5 per 100,000).
- The most recent incidence rates in the Greater Bay Area (7.3 per 100,000) were comparable to those in California (7.3 per 100,000) overall for both males and females among all racial and ethnic groups.
- In 2020, 665 cases of stomach cancer were diagnosed in Greater Bay Area residents. This is down 12.8% from 2019 (585 cases).
Stomach Cancer - Mortality

Mortality Rate, 2016-2020
- Among males, NH Black males had the highest stomach cancer mortality rate (6.6 per 100,000) and NH White males had the lowest mortality rate (3.3 per 100,000). Among females, Hispanic females had the highest mortality rate (4.2 per 100,000) and NH White females had the lowest mortality rate (1.6 per 100,000).
- Mortality rates for stomach cancer in the Greater Bay Area (3.6 per 100,000) were similar to that of California (3.8 per 100,000) overall.
- In 2020, 334 stomach cancer-related deaths occurred in Greater Bay Area residents.
References
[1] National Cancer Institute, Stomach Cancer. Available at: https://www.cancer.gov/types/stomach. U.S. Department of Health and Human Services, National Cancer Institute, Bethesda, MD.
[2] World Cancer Research Fund International, Stomach cancer statistics. Available at: https://www.wcrf.org/cancer-trends/stomach-cancer-statistics/.
Testisticular Cancer
Testicular cancer is rare, accounting for only 1% of cancers in the U.S., but it is the most common cancer among males aged 35-39 [1,2]. Moreover, it is a high survival cancer, with a five-year survival rate of 95% in the U.S [1]. Nevertheless, testicular cancer has garnered attention due to its increasing incidence since the 1990s [3]. Known risk factors for testicular cancer are few and include developmental abnormalities of the testis and a family history of testicular cancer; recent research suggests that environmental exposure to organochloride pesticides may be a risk factor of testicular cancer [2,4].
Incidence (1988-2019) Trends
- Increases in incidence from 1988 through 2019 were observed for all racial and ethnic groups, but the largest annual increase in incidence was observed among Hispanic males (2.6%). The overall annual increase for all males was 1.0%.
Testicular Cancer - Incidence

According to California Department of Public Health guidelines, cancer incidence rates cannot be reported if based on less than 15 cancer cases and/or a population of less than 10,000 to ensure confidentiality and stable statistical rates.
Incidence Rate, 2016-2020
- From 2016-2020, the incidence of testicular cancer was highest among NH White males (9.0 per 100,000), followed by Hispanic (6.6 per 100,000), AAPI (2.7 per 100,000), and NH Black (2.2 per 100,000) males.
- The incidence of testicular cancer among NH White males in the Greater Bay Area (9.0 per 100,000) was higher compared to California overall (7.8 per 100,000). For all other racial and ethnic groups, incidence rates were similar between the Greater Bay Area and California.
- In 2019, 240 males in the Greater Bay Area were diagnosed with testicular cancer. This was similar to that reported for 2020 (236 cases).
Mortality Rate, 2016-2020
- The mortality rate among all males was low: less than 0.2 per 100,000 from 2016-2020.
- The mortality rate of testicular cancer in the Greater Bay Area (0.2 per 100,000) was similar for all racial and ethnic groups compared to California overall (0.3 per 100,000).
- From 2016 to 2020, just 36 testicular cancer deaths occurred among males in the Greater Bay Area.
Data Tables - Testicular Cancer
References
[1] American Cancer Society. Cancer Facts & Figures 2022. Atlanta: American Cancer Society; 2022
[2] McGlynn, Katherine A., and Michael B. Cook. “Etiologic factors in testicular germ-cell tumors.” Future oncology 5.9 (2009): 1389-1402.
[3] Ghazarian, Armen A., et al. “Recent trends in the incidence of testicular germ cell tumors in the United States.” Andrology 3.1 (2015): 13-18.
[4] McGlynn KA, Trabert B. Adolescent and adult risk factors for testicular cancer. Nat Rev Urol. 2012;9(6):339-349. Published 2012 Apr 17. doi:10.1038/nrurol.2012.61
Myeloma
Myeloma, also referred to as multiple myeloma, affects the plasma cells, which are found in bone marrow. Plasma cells make antibodies that help the body respond to an infection by attacking and killing germs. When plasma cells become cancerous, they create an abnormal protein, or antibody, that grows out of control. This cancer occurs more commonly in males, particularly NH Black males. Other risk factors include older age, family history of myeloma, obesity, and having other plasma cell diseases [1].
Incidence (1988-2019) and Mortality (1988-2020) Trends
- The incidence rate of myeloma has increased annually among all males (0.7%) and females (0.5%) from 1988 through 2019.
- Incidence among NH White males and females increased most significantly (1.0%), followed by Hispanic males and females, combined (0.8%). Rates have remained stable among NH Black males and females and AAPI males and females.
- Overall, there were declines in mortality among both males (-1.2%) and females. (-1.6%). The steepest decline was among NH Black (-1.8%) and NH White (-1.4%) males and females.
Myeloma - Incidence

Incidence Rates, 2016-2020
- NH Black males and females had almost double the incidence of myeloma compared to other races and ethnicities.
- The incidence rate for NH Black males was 16.4 per 100,000, compared to 8.3 per 100,000 for NH White males, 7.9 per 100,000 for Hispanic males, and 4.7 per 100,000 for AAPI males.
- For females, the incidence rate for NH Black females was 11.4 per 100,000 compared to Hispanic females (5.5 per 100,000), NH White females (4.8 per 100,000) and AAPI females (3.5 per 100,000).
- The most recent incidence rates (2016-2020) show that the overall Greater Bay Area rate (6.3 per 100,000) was similar to the incidence rate for California overall (6.1 per 100,000).
- In the year 2020, 506 myeloma cases were diagnosed among Greater Bay Area residents. This is down 12.6% from 2019 (579 cases).
Myeloma - Mortality

According to California Department of Public Health guidelines, cancer incidence rates cannot be reported if based on less than 15 cancer cases and/or a population of less than 10,000 to ensure confidentiality and stable statistical rates.
Mortality Rate, 2016-2020
- NH Black males and females had the highest myeloma mortality rates when compared to all other racial and ethnic groups. NH Black males had a rate of 8.1 per 100,000, almost twice the rate of NH Black females (4.9 per 100,000). A similar trend was seen for the NH White population (males: 3.5 per 100,000, females: 2.0 per 100,000) and the AAPI population (males: 2.1 per 100,000, females: 1.2 per 100,000). Hispanic males (3.1 per 100,000) and females (2.5 per 100,000) had similar rates.
- In the year 2020, 236 deaths in myeloma patients occurred among Greater Bay Area residents.
Reference
[1] American Cancer Society. (2018, February 28). Risk factors for multiple myeloma. https://www.cancer.org/cancer/multiple-myeloma/causes-risks-prevention/risk-factors.html#references
Brain and Other Nervous System Cancers
There are many different types of brain and other nervous system tumors included in this classification: astrocytic tumors, oligodendroglial tumors, mixed gliomas, and others [1]. Tumors may be benign or malignant, however data below pertain only to malignant brain tumors. Risk factors are generally unknown; however, having specific genetic syndromes may increase the risk of a central nervous system tumor. Tumors found in the brain have often started somewhere in the body and spread to one or more parts of the brain (metastases). Brain and other nervous system cancers are one of the most common cancers among children [2].
Glioblastoma
While glioblastoma multiforme (GBM) is relatively rare, its poor prognosis and resulting rates of mortality make it an important public health issue. These tumors arise in glial cells, a specific type of cell in the brain that surrounds neurons and provides support and insulation. Glial cells are the most abundant cell type in the central nervous system [3].
Incidence (1988-2019) and Mortality (1988-2020) Trends
- For males and females of all racial and ethnic groups combined in the Greater Bay Area, incidence decreased from 1988-2019 (-0.5%).
- The largest decline in incidence occurred among Hispanic males (-1.1%).
- Mortality for males and females in all racial and ethnic groups decreased in the Greater Bay Area from 1988-2020 (-0.5%).
Incidence - Brain and Other Nervous Systems Cancer

According to California Department of Public Health guidelines, cancer incidence rates cannot be reported if based on less than 15 cancer cases and/or a population of less than 10,000 to ensure confidentiality and stable statistical rates.
Incidence Rate, 2016-2020
- Males had higher incidence rates (6.9 per 100,000) compared to females (4.4 per 100,000).
- Brain and other nervous system cancers are significantly more common among NH White males and females than other racial and ethnic groups.
- The most recent incidence rates (2016-2020), show that compared to all other racial and ethnic groups, NH White males and females (7.2 per 100,000) have significantly higher incidence rate of brain and central nervous system cancer, followed by Hispanic males and females (4.7 per 100,000), NH Black males and females (4.0 per 100,000), and AAPI males and females (3.7 per 100,000).
- Brain and other nervous system cancer incidence was similar in California overall (5.9 per 100,000) and the Greater Bay Area (5.6 per 100,000).
- In 2020, there were 437 cases of brain and other nervous system cancers diagnosed in the Greater Bay Area residents. This is similar to that reported in 2019 (440 cases).
Mortality - Brain and Other Nervous Systems Cancer

According to California Department of Public Health guidelines, cancer incidence rates cannot be reported if based on less than 15 cancer cases and/or a population of less than 10,000 to ensure confidentiality and stable statistical rates.
Mortality Rate, 2016-2020
- NH White males and females (4.9 per 100,000) had the highest mortality rate compared to all other racial and ethnic groups, followed by Hispanic males and females (2.8 per 100,000). NH Black (2.5 per 100,000) and AAPI (2.5 per 100,000) males and females had lower rates of mortality, comparatively.
- Recent mortality rates show that California (4.3 per 100,000) rates were slightly higher compared to mortality rates in the Greater Bay Area (3.8 per 100,000).
- In the year 2020, 346 brain and other nervous system cancer deaths occurred among Greater Bay Area residents.
References
[1] SEER. Cancer of the Brain and Other Nervous System - Cancer Stat Facts. Available from: https://seer.cancer.gov/statfacts/html/brain.html
[2] SEER. Annual Report to the Nation 2021. Available from: https://seer.cancer.gov/report_to_nation/.
Cervical Cancer
Cervical cancer is almost entirely caused by human papilloma virus (HPV) infection [1]. Cervical cancer typically develops slowly, and regular screenings (“Pap” and/or HPV testing) can detect high-risk HPV types and changes that occur in the cells before cancer develops [1]. Cervical cancer screenings have contributed to declines in incidence; however screening rates remain lower among women of color, in rural areas and among uninsured women [2]. In addition to screenings, HPV vaccination is recommended for adolescents and young adults. The vaccine has led to a dramatic reduction in the prevalence of HPV in young American females since it was introduced in 2006 [3,4]. Barriers to obtaining timely cervical cancer screenings and vaccinations must be addressed by clinicians, health care systems, and public health institutions for all population groups to benefit from these effective interventions [5,6].
Incidence (1988-2019) and Mortality (1988-2020) Trends
- The annual incidence of cervical cancer cases has declined substantially (-1.9%) since 1988 in all racial and ethnic groups. The greatest declines were among Hispanic females (-3.5%) and AAPI females (-3.1%). NH White females also experienced a significant decline in incidence (-1.5%).
- The mortality rate declined among all racial and ethnic groups since 1988 (-2.4%).
Cervical Cancer - Incidence

According to California Department of Public Health guidelines, cancer incidence rates cannot be reported if based on less than 15 cancer cases and/or a population of less than 10,000 to ensure confidentiality and stable statistical rates.
Incidence Rate, 2016-2020
- The most recent incidence rates (2016-2020) show that, compared to all other racial and ethnic groups, Hispanic females (6.8 per 100,000) had the highest incidence rate of cervical cancer. This may in part be due to low rates of cervical cancer screening in this population [1]. NH Black females had the second highest incidence rate (6.3 per 100,000). AAPI (5.2 per 100,000) and NH White (4.9 per 100,000) females had significantly lower rates compared to Hispanic females.
- Incidence rates by age appeared to peak among the 40-44 year old age group (11.7 per 100,000).
- The cervical cancer incidence rate in the Greater Bay Area (5.5 per 100,000) was significantly lower for all races and ethnicities combined compared to the rate for California overall (7.4 per 100,000).
- In the year 2020, there were 206 cervical cancers diagnosed among Greater Bay Area residents. This is down 17.3% from 2019 (249 cases).
Cervical Cancer - Mortality

According to California Department of Public Health guidelines, cancer incidence rates cannot be reported if based on less than 15 cancer cases and/or a population of less than 10,000 to ensure confidentiality and stable statistical rates.
Mortality Rate, 2016-2020
- In recent years (2016-2020) NH Black (2.3 per 100,000) and Hispanic (1.7 per 100,000) females had the highest mortality rates when compared to AAPI (1.5 per 100,000) and NH White (1.1 per 100,000) females.
- The cervical cancer mortality rate in the Greater Bay Area (1.4 per 100,000) was significantly lower for all races and ethnicities combined compared to the rate for California overall (2.2 per 100,000).
- In the year 2020, there were 70 cervical cancer deaths that occurred among Greater Bay Area
References
[1] National Cancer Institute. What is Cervical Cancer? Updated: June 15, 2023. Available at https://www.cancer.gov/types/cervical.
[2] Suk R, Hong Y, Rajan SS, Xie Z, Shu Y, Spencer J. Assessment of US Preventive Services Task Force Guideline–Concordant Cervical Cancer Screening Rates and Reasons for Underscreening by Age, Race and Ethnicity, Sexual Orientation, Rurality, and Insurance, 2005 to 2019. JAMA Network Open. 2022;5(1):e2143582. https://jamanetwork.com/journals/jamanetworkopen/fullarticle/2788175.
[3] Rosenblum HG, Lewis RM, Gargano JW, Querec TD, Unger ER, Markowitz LE. Declines in Prevalence of Human Papillomavirus Vaccine-Type Infection Among Females after Introduction of Vaccine — United States, 2003–2018. MMWR Morb Mortal Wkly Rep 2021;70:415–420. DOI: http://dx.doi.org/10.15585/mmwr.mm7012a2
[4] Mix JM, Van Dyne EA, Saraiya M, Hallowell BD, Thomas CC. Assessing impact of HPV vaccination on cervical cancer incidence in women 15–29 years in the United States, 1999–2017: An ecologic study. Cancer Epidemiology, Biomarkers & Prevention 2020.
[5] Islami F, Guerra CE, Minihan A, Yabroff KR, Fedewa SA, Sloan K, Wiedt TL, Thomson B, Siegel RL, Nargis N, Winn RA, Lacasse L, Makaroff L, Daniels EC, Patel AV, Cance WG, Jemal A. American Cancer Society's report on the status of cancer disparities in the United States, 2021. CA Cancer J Clin. 2022 Mar;72(2):112-143. doi: 10.3322/caac.21703. Epub 2021 Dec 8. PMID: 34878180
[6] Fuzzell LN, Perkins RB, Christy SM, Lake PW, Vadaparampil ST. Cervical cancer screening in the United States: Challenges and potential solutions for underscreened groups. Preventive Medicine Vol 144. 2021 https://doi.org/10.1016/j.ypmed.2020.106400