Annual Report 1988-2022


Top Ten Cancers in the Greater Bay Area: Incidence and Mortality,1988-2022

In our 2025 report, the Greater Bay Area Cancer Registry describes incidence and mortality for the top ten cancers in the nine Bay Area counties of its region. Downloadable data sheets for each of the top ten cancer sites are provided (data for additional cancer sites are available upon request to [email protected]).

Introduction

The Greater Bay Area Cancer Registry (GBACR), part of the California Cancer Registry (CCR) and the SEER program, is operated by the University of California, San Francisco (UCSF) and collects information on all newly diagnosed cancers occurring in residents of nine Greater Bay Area counties: Alameda, Contra Costa, Marin, Monterey, San Benito, San Francisco, San Mateo, Santa Clara, and Santa Cruz. Statewide cancer reporting began in California in 1988. At present, the most recent year of complete cancer ascertainment and follow-up for deaths is 2022. 


This report highlights current cancer statistics for the ten most common invasive cancers, defined as tumors that have spread beyond the tissue of origin to other parts of the body. The report is based on available data for new cases of cancer and cancer deaths for the 35-year period from 1988 through 2022. Site-specific data sheets include incidence and mortality rates, information on trends in incidence and mortality over time, and highlight the most recent five years of data from 2018-2022. Data were suppressed when less than 11 cancer cases were recorded in any given year or for populations under 20,000. As a result, information for males or females or certain racial or ethnic groups, as well as between-group comparisons, may not be available. Statewide and nationwide (SEER) rates are included for comparison (see County-Specific Incidence and Mortality Rates worksheet and Comparison worksheet). A detailed guide to data in the files appears in the first worksheet entitled “README”.
 

Since 1988, the overall incidence and mortality rates of cancer (calculated as the number of new cases and deaths per 100,000 individuals in the population at risk, respectively) have greatly decreased in the Greater Bay Area. For each cancer site, there are notable differences in rates by sex, race, and ethnicity, but overall, there are patterns of decreasing incidence and mortality for most cancer sites. In the provided data files, we focus on sex- and racial and ethnic-specific cancer rates and trends for (1) Asian American, Native Hawaiian, and Pacific Islander (AANHPI), (2) Hispanic, (3) non-Hispanic (NH) Black and (4) NH White populations. Population estimate data for calculating age-adjusted incidence rates for specific AANHPI ethnicities as well as other distinct racial and ethnic groups are needed for cancer surveillance in our diverse communities; these data are not yet available for recent years.  
 

Population Data Used for Calculating Rates

We use the 2010-2019 intercensal population estimates that were produced by Woods & Poole Economics, Inc. through a contract with the NCI SEER program. The methodology follows previously published Census methodologies to align closely with the anticipated Census Bureau’s county intercensal estimates by demographic characteristics that are tentatively scheduled to be released in late 2025. The population estimates incorporate intercensal (2000-2009, 2010-2019) and Vintage 2023 (2020-2023) bridged race estimates that are derived from the original multiple race categories in the 2000, 2010 and 2020 Censuses. The bridged race estimates and a description of the methodology used to develop them appear on the National Center for Health Statistics website. Read more about population estimates for this data release here.

Announcing our latest tool: Rural Atlas

Our latest cancer data tool, the Rural Atlas is now available here: 

Rural Atlas

The Rural Atlas is intended to help better understand differences in cancer epidemiology across the rural–urban dichotomy in the Helen Diller Family Comprehensive Cancer Center (HDFCCC) Catchment area. The Rural Atlas can be a flexible tool for informing local efforts for outreach and programs.

There are multiple measures to define rurality, with no clear consensus about what separates an urban area from a rural one. The Rural Atlas uses two definitions of rurality (percent rural and RUCA) to characterize the 25-county catchment area to explore cancer incidence, stage, and survival by rurality down to the Census tract level. Within the Rural Atlas dashboard, users can select from four views.

1.    Maps of rurality by region
2.    Cancer incidence, stage, and survival by rurality and region
3.    Rurality comparisons by region and rurality definition
4.    Rurality comparisons by rurality definition and region

Data were compiled using Census 2010 geographies to match the population denominators available for cancer incidence rates. Demographic and cancer risk factor data were sourced from the UCSF Health Atlas which draws data from the American Community Survey (ACS) 2015-2019 and CDC Places 2023 release for 2010 geographies. California Cancer Registry 2018-2022 data was used to generate incidence, late stage, and survival rates. Five-year incidence for female breast, prostate, lung, colorectal, and skin (melanoma) cancer was calculated using cases from 2018-2022 and denominators produced by Woods & Poole Economics, Inc. with support from NCI. Late stage was defined as percentage of cases classified as remote or distant. Survival was defined as overall 5-year survival from 2018-2022. 

Incidence and Mortality in the Greater Bay Area, 1988-2022

Overall rates of invasive cancers have decreased during the 35-year period from 1988 through 2022 in the Greater Bay Area. Significant declines were also noted by the American Cancer Society in their 2025 Annual Cancer Statistics report [1].  


After reporting an approximate 9.5% fewer cases in 2020 due to the reduction in screening and diagnosis with the COVID-19 pandemic, we continue to see the number of cancer cases diagnosed aligned with expectations prior to 2020. In fact, we report a slight increase in the number of cancer cases since 2021, while deaths due to cancer continue to fall in the Greater Bay Area. The recent increase in incidence may be attributable to cancers diagnosed at a later stage. Breast (female invasive) and prostate cancers are likely driving this trend. For distant stage female breast cancer, we report a significant increase in incidence at 8.1% per year since 2019. For prostate cancers diagnosed at distant stage, we report a significant 6.0% increase per year since 2010. Recent increases in distant stage for these cancers have been reported nationally and statewide for California [2, 3, 4].


The five most common invasive cancers—breast, prostate, lung and bronchus, colorectal, and uterine—accounted for half (50.5%) of all newly diagnosed cancers in the Greater Bay Area. Lung and bronchus, breast, prostate, colorectal, and pancreatic cancers were the most common cause of cancer deaths, collectively accounting for slightly less than half (47.8%) of all cancer deaths in the Greater Bay Area from 2018 to 2022. 
 

Incidence and Mortality Trends Over Time

  • Since 1988, yearly incidence of invasive cancer has declined more among males (-0.7%) than females (-0.1%). This is driven largely by declines in the incidence of smoking-related cancers (e.g., lung and bronchus) and prostate cancer in males. In recent years, since 2016, incidence among females has increased by 1.2% per year, while remaining stable among males. 
  • A significant annual decline has occurred for cancer mortality since 1988 (males: -2.0%; females: -1.7%). This is likely due to a combination of factors, including advancements in treatment, continued increased screening, and the effects of a continued reduction in smoking behavior.  

Incidence, 2018-2022

  • In 2022, 37,139 invasive cancers were diagnosed in the Greater Bay Area. 
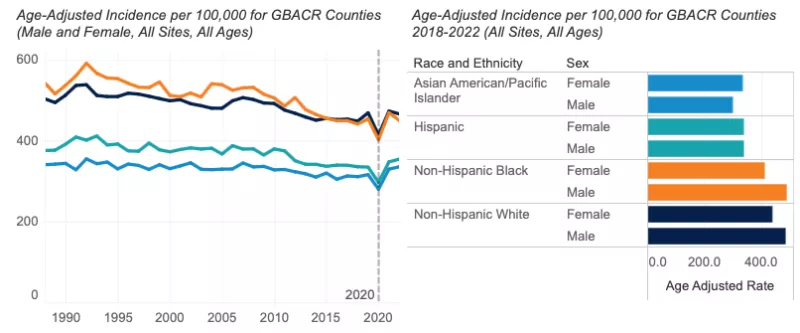
  • The incidence of all invasive cancers from 2018-2022 was higher in males (420.3 per 100,000) than females (394.1 per 100,000). 
    • Males: Incidence was highest among NH Black males (487.7 per 100,000), followed by NH White (483.4 per 100,000), Hispanic (340.3 per 100,000), and AANHPI males (299.3 per 100,000).
    • Females: NH White females had the highest cancer incidence (437.7 per 100,000), followed by NH Black (411.3 per 100,000), Hispanic (338.1 per 100,000), and AANHPI (333.8 per 100,000) females.
  • Among Greater Bay Area counties, Santa Cruz County had the highest overall cancer incidence among males and females combined (462.6 per 100,000), followed by Marin County (455.3 per 100,000). This appears to be driven by higher incidence of female breast cancer and melanoma (particularly among males). Alameda County had the lowest overall cancer incidence rate (380.2 per 100,000).
  • Cancer incidence among males was lower in the Greater Bay Area than California overall (420.3 vs. 427.6 per 100,000). Among females, overall cancer incidence was similar in the Greater Bay Area when compared to all of California (394.1 vs. 391.3 per 100,000, respectively). 
     

Mortality, 2018-2022

  • In 2022, 10,286 cancer deaths occurred in the Greater Bay Area.
  • Cancer mortality from 2018-2022 was higher in males (137.2 per 100,000) than females (104.9 per 100,000).
    • Males: Mortality was highest among NH Black males (202.4 per 100,000), followed by NH White (144.9 per 100,000), Hispanic (120.9 per 100,000), and AANHPI (111.3 per 100,000) males.
    • Females: NH Black females had the highest cancer mortality (149.6 per 100,000), followed by NH White (111.7 per 100,000), Hispanic (93.9 per 100,000), and AANHPI (83.8 per 100,000) females.
  • From 2018 through 2022, overall cancer mortality in the Greater Bay Area was significantly lower than California for both males (137.2 vs. 155.8 per 100,000) and females (104.9 vs. 117.4 per 100,000).
     

Data Tables - All Cancer Sites

References

[1] American Cancer Society. Cancer Facts & Figures 2025.  Atlanta: American Cancer Society; 2025.

[2] Hendrick, R. E. and D. L. Monticciolo (2024). "Surveillance, Epidemiology, and End Results Data Show Increasing Rates of Distant-Stage Breast Cancer at Presentation in U.S. Women." Radiology 313(3): e241397.

[3] Giaquinto, A. N., H. Sung, L. A. Newman, R. A. Freedman, R. A. Smith, J. Star, A. Jemal and R. L. Siegel (2024). "Breast cancer statistics 2024." CA Cancer J Clin 74(6): 477-495.

[4] Van Blarigan, E. L., M. A. McKinley, S. L. Washington, 3rd, M. R. Cooperberg, S. A. Kenfield, I. Cheng and S. L. Gomez (2025). "Trends in Prostate Cancer Incidence and Mortality Rates." JAMA Netw Open 8(1): e2456825.


Female Invasive Breast Cancer

Invasive breast cancer is the most common cancer in females, accounting for approximately a third of all invasive cancers diagnosed annually in the Greater Bay Area and in California. Recent evidence of increasing breast cancer incidence also has been reported nationwide among females of all racial and ethnic groups with a notable increase among females younger than 50 years of age and Asian American Pacific Islander females of all ages [1]. About one in eight females in the United States (U.S.) will develop invasive breast cancer within their lifetime. Risk factors include older age, family history of breast cancer, inherited genetic mutations (BRCA1 and BRCA2), early age of menarche, late age of menopause, no pregnancies or pregnancies later in life (i.e., first pregnancy after age 30), postmenopausal hormone therapy use, obesity and excessive weight gain, physical inactivity, alcohol consumption, and dense breast tissue (as indicated on a mammogram). However, risk factors differ across subtypes of breast cancer [2-5]. The U.S. Preventive Services Task Force recommends biennial screening mammography for breast cancer for most females 40 to 74 years of age. This recommendation states that current evidence is insufficient to assess the balance of benefits and harms of screening mammography in females more than 75 years of age [6].

Data Tables - Breast Cancer

References

[1] Giaquinto, A. N., H. Sung, L. A. Newman, R. A. Freedman, R. A. Smith, J. Star, A. Jemal and R. L. Siegel (2024). "Breast cancer statistics 2024." CA Cancer J Clin 74(6): 477-495. 
[2] National Cancer Institute. SEER Cancer Stat Facts: Female Breast Cancer. National Cancer Institute. Bethesda, MD, https://seer.cancer.gov/statfacts/html/breast.html 
[3] Song, M. and E. Giovannucci, Preventable Incidence and Mortality of Carcinoma Associated With Lifestyle Factors Among White Adults in the United States. JAMA Oncol, 2016. 2(9): p. 1154-61.
[4] Sprague, B.L., et al., Proportion of invasive breast cancer attributable to risk factors modifiable after menopause. Am J Epidemiol, 2008. 168(4): p. 404-11.
[5] Tamimi, R.M., et al., Population Attributable Risk of Modifiable and Nonmodifiable Breast Cancer Risk Factors in Postmenopausal Breast Cancer. Am J Epidemiol, 2016. 184(12): p. 884-893.
[6] Screening for Breast Cancer: U.S. Preventive Services Task Force Recommendation Statement. JAMA, 2024. 331(22): p. 1918-1930. Available at: https://www.uspreventiveservicestaskforce.org/uspstf/recommendation/breast-cancer-screening

Prostate Cancer

Prostate cancer was the most commonly diagnosed cancer among males in the Greater Bay Area in the years 1988 through 2022. Prostate cancer typically develops slowly, and males diagnosed with non-metastatic prostate cancer are more likely to die with the disease than of it. Risk factors include family history, increasing age, and race. Prostate cancer incidence rates in the U.S. spiked in 1992 then steadily declined, a trend that has been attributed to the widespread adoption of PSA testing [1]. However, the incidence increased by 3.2% per year from 2014 through 2022 in the Greater Bay Area, with the greatest increase in incidence among people diagnosed with advanced stage disease [2]. The U.S. Preventive Services Task Force recommends that males 70 years and older should not be screened for prostate cancer and those aged 55-69 should discuss with their clinician the relative risks and benefits of early detection and treatment, and then make an individual decision whether to be screened [3]. The American Cancer Society also recommends that men make an informed decision with their healthcare provider regarding whether to be screened for prostate cancer. They recommend that men at average risk for prostate cancer should discuss PSA screening with their doctor starting at age 50 years. For men with higher risk, the conversation should occur earlier (40 or 45 years old, depending on individual risk factors) [4]

Data Tables - Prostate Cancer

References

[1] Siegel, R. L., T. B. Kratzer, A. N. Giaquinto, H. Sung and A. Jemal (2025). "Cancer statistics, 2025." CA Cancer J Clin 75(1): 10-45. Available at: https://acsjournals.onlinelibrary.wiley.com/doi/10.3322/caac.21871

[2] Van Blarigan, E. L., M. A. McKinley, S. L. Washington, 3rd, M. R. Cooperberg, S. A. Kenfield, I. Cheng and S. L. Gomez (2025). "Trends in Prostate Cancer Incidence and Mortality Rates." JAMA Netw Open 8(1): e2456825.

[3] US Preventive Services Task Force. Grossman, S. J. Curry, D. K. Owens, K. Bibbins-Domingo, A. B. Caughey, K. W. Davidson, C. A. Doubeni, M. Ebell, J. W. Epling, Jr., A. R. Kemper, A. H. Krist, M. Kubik, C. S. Landefeld, C. M. Mangione, M. Silverstein, M. A. Simon, A. L. Siu, and C. W. Tseng. "Screening for Prostate Cancer: US Preventive Services Task Force Recommendation Statement." JAMA 319, no. 18 (May 8 2018): 1901-13. https://dx.doi.org/10.1001/jama.2018.3710. 

[4] American Cancer Society. American Cancer Society Recommendations for Prostate Cancer Early Detection. 2023 Nov 22.  Available at: https://www.cancer.org/cancer/types/prostate-cancer/detection-diagnosis-staging/acs-recommendations.html
 

Lung and Bronchus Cancer

Smoking remains by far the leading risk factor for lung and bronchus cancer (hereafter lung cancer) [1]. In California, the prevalence of tobacco smoking continues to decline; in 2003, 16.5% of Californians smoked compared to 5.1% in 2023 [2]. However, despite these declines, lung cancer remains the second-most common cancer among males (behind prostate) and females (behind breast). CDC notes that in the United States, about 10% to 20% of lung cancers, or 20,000 to 40,000 lung cancers each year, happen in people who never smoked, and recent studies have noted that lung cancer may be increasing in never smokers, particularly among females. Exposures to radon, air pollution and second-hand smoke also play a role [3]. Lung and bronchus cancer is also the most common cause of cancer deaths in the Greater Bay Area, California, and nationwide [4]. 

Data Tables - Lung Cancer

References

[1] Lung Cancer Prevention (PDQ): https://www.cancer.gov/types/lung/patient/lung-prevention-pdq

[2] UCLA Center for Health Policy Research: https://healthpolicy.ucla.edu/.

[3] Center for Disease Control and Prevention. “Lung Cancer Among People Who Never Smoked”. October 15, 2024. Available at: https://www.cdc.gov/lung-cancer/nonsmokers/.

[4] American Cancer Society. Cancer Facts & Figures 2025. Atlanta: American Cancer Society; 2025. Available at: https://www.cancer.org/content/dam/cancer-org/research/cancer-facts-and-statistics/annual-cancer-facts-and-figures/2025/2025-cancer-facts-and-figures-acs.pdf

Colorectal Cancer

Colorectal cancer was the fourth most common cancer diagnosed in the Greater Bay Area in the most recent years (2018-2022). Usually, these cancers develop when tissue in the inner surface of the colon or rectum starts to grow, forming a polyp [1]. Older age, obesity, smoking, history of colorectal polyps, alcohol consumption, and a diet high in red and processed meats are associated with increased risk of this cancer [1-3]. Adhering to colorectal cancer screening guidelines, engaging in regular physical activity, and a diet rich in whole grains and dairy products are associated with lower risk of colorectal cancer [3]. Colorectal cancer screening is important because it can identify polyps that could lead to in situ or invasive cancer, allowing for early intervention (removal of the polyp). The U.S. Preventive Services Task Force recommends screening for colorectal cancer in adults aged 45-75 years [4]. While incidence of colorectal cancer is decreasing overall, the incidence of colorectal cancer is increasing among people less than 50 years of age throughout the U.S., including California [5,6].

Data Tables - Colorectal Cancer

References

[1] National Cancer Institute, SEER Cancer Statistics Factsheets: Colon and Rectum. Available at: http://seer.cancer.gov/statfacts/html/colorect.html. U.S. Department of Health and Human Services, National Cancer Institute, Bethesda, MD.

[2] National Cancer Institute, Colon Cancer Treatment-Patient Version (PDQ). Available at: https://www.cancer.gov/types/colorectal/patient/colon-treatment-pdq#section/_112. U.S. Department of Health and Human Services, National Cancer Institute, Bethesda, MD.

[3] World Cancer Research Fund International, Colorectal Cancer. Available at: https://www.wcrf.org/diet-activity-and-cancer/cancer-types/colorectal-cancer/. Accessed on June 28, 2023. WCRF International, London.

[4] US Preventive Services Task Force Recommendation Statement. Screening for Colorectal Cancer: JAMA, 2021. 325(19): p. 1965-1977. 

[5] Ellis, L., et al., Colorectal Cancer Incidence Trends by Age, Stage, and Racial/Ethnic Group in California, 1990-2014. Cancer Epidemiol Biomarkers Prev, 2018. 

Uterine Cancer

Uterine cancer is the most common gynecologic cancer and is primarily diagnosed in post-menopausal females, with incidence peaking in the sixth decade of life [1]. In addition to age, other risk factors include obesity, estrogen-only hormone replacement therapy, and family history of uterine, colon, or ovarian cancer. Endometrial cancer (lining of the uterus) accounts for more than 90% of uterine cancers [1,2]. Rates and trends should be interpreted carefully due to the difficulty in identifying true at-risk populations (females who have not had a hysterectomy), which may vary across time and racial and ethnic groups. For example, NH Black females experience higher hysterectomy rates in the U.S., partly due to higher prevalence of uterine fibroids [3]. However, hysterectomy data is not available and thus not used in these calculations.

Data Tables - Uterine Cancer

References

[1] Centers for Disease Control and Prevention. What Are the Risk Factors for Uterine Cancer?; 2024 Feb 23. Available from: https://www.cdc.gov/uterine-cancer/risk-factors/index.html 

[2] Cancer.Net. Uterine Cancer - Statistics; 2024 Jan 17. Available from: https://www.cancer.net/cancer-types/uterine-cancer/statistics 

[3] Temkin, Sarah M et al. “The End of the Hysterectomy Epidemic and Endometrial Cancer Incidence: What Are the Unintended Consequences of Declining Hysterectomy Rates?.” Frontiers in oncology vol. 6 89. 14 Apr. 2016, doi:10.3389/fonc.2016.00089 

Invasive Melanoma

Invasive melanoma, a cancer of the skin’s pigment cells, is more common among populations with fair complexions and prolonged exposure to ultraviolet (UV) light from the sun or tanning beds. NH White populations have a 3% lifetime risk of melanoma, compared to 0.1% for NH Black and 0.5% in Hispanic populations [1]. It is significantly more common among NH White males than NH White females. In the Greater Bay Area, among NH White males, melanoma was the second most common newly diagnosed invasive cancer. Compared to other types of skin cancers, melanoma is more likely to spread to other parts of the body [2]. 

Data Tables - Melanoma

References

[1] American Cancer Society. Key Statistics for Melanoma Skin Cancer. 2024 Jan 16. Available at: https://www.cancer.org/cancer/types/melanoma-skin-cancer.html

[2] National Cancer Institute, Melanoma Treatment (PDQ®)–Patient Version. Available at: https://www.cancer.gov/types/skin/patient/melanoma-treatment-pdq. U.S. Department of Health and Human Services, National Cancer Institute, Bethesda, MD. 

Non-Hodgkin Lymphoma

Non-Hodgkin Lymphoma is a cancer that starts in cells called lymphocytes, which are part of the body’s immune system. Lymphomas can start anywhere that lymph tissue is found, such as lymph nodes, the spleen, bone marrow, and the tonsils [1]. Lymphomas can be indolent, meaning the cancer does not need immediate treatment but should be monitored closely. They can also be aggressive, requiring immediate treatment due to their ability to grow and spread quickly. Factors affecting an individual’s risk of developing Non-Hodgkin Lymphoma include immune disorders, infections, genetics, family history, and occupational factors [2,3]. Non-Hodgkin Lymphoma is a common cancer, but progress has been made to reduce mortality in recent years. Since 2015, incidence rates have declined approximately 1% per year nationwide. From 2013-2022, mortality rates for Non-Hodgkin Lymphoma have declined by around 2% per year [4].

Data Tables - Non-Hodgkin Lymphoma

References

[1] American Cancer Society. What Is Non-Hodgkin Lymphoma? 2024 Feb 15. Available at: https://www.cancer.org/cancer/types/non-hodgkin-lymphoma/about/what-is-non-hodgkin-lymphoma.html

[2] SEER Cancer Stat Facts: Non-Hodgkin Lymphoma. National Cancer Institute. Bethesda, MD, https://seer.cancer.gov/statfacts/html/nhl.html 

[3] Armitage, J.O., et al., Non-Hodgkin lymphoma. Lancet, 2017. 390(10091): p. 298-310.

[4] American Cancer Society. Key Statistics for Non-Hodgkin Lymphoma. 2025 Jan 16. Available at: https://www.cancer.org/cancer/types/non-hodgkin-lymphoma/about/key-statistics.html

Bladder Cancer

Bladder cancer is the eighth most common cancer and four times more prevalent among males than females. As of 2022, approximately 94% of cases occur in those ages 55 and over [1]. NH White males and females are more likely to be diagnosed with bladder cancer than any other racial and ethnic group. The largest risk factor for bladder cancer is smoking tobacco, which contributes to 50-65% of all cases; up to another 20% of bladder cancer can be attributed to exposure to chemicals in textile, rubber, leather, and print industries [2]. Bladder cancer mortality rates have been decreasing since 1988, by about 1% per year in both males and females. These improvements in mortality rates may be attributed to better awareness and treatments of bladder cancer [3].

Data Tables - Bladder Cancer

References

[1] SEER Cancer Stat Facts: Bladder Cancer. National Cancer Institute. Bethesda, MD, https://seer.cancer.gov/statfacts/html/urinb.html   

[2] Saginala, K., Barsouk, A., Aluru, J. S., Rawla, P., Padala, S. A., & Barsouk, A. (2020). Epidemiology of Bladder Cancer. Medical Sciences, 8(1), 15. https://doi.org/10.3390/medsci8010015 

[3] American Cancer Society. Key Statistics for Bladder Cancer. 2025 Jan 22. Available at: https://www.cancer.org/cancer/types/bladder-cancer/about/key-statistics.html


Kidney Cancer

Kidney cancer is about twice as common in males than females and is more common in NH Black and American Indian and Alaska Native populations, although reasons for this are not clear [1]. Established risk factors for kidney cancer include tobacco smoking, obesity, and history of hypertension and chronic kidney disease [2]. Most kidney cancers (between 60-70%) are diagnosed before the cancer has spread outside the kidney (localized stage), and the observed incidence trends are driven by the trends in localized disease [3,4]. The increasing incidence rate can in part be attributed to the greater use of medical imaging procedures, which results in incidental detection of early kidney cancers. Increasing kidney cancer incidence may also reflect changes in the prevalence of kidney cancer risk factors, such as obesity and hypertension, in the population [4]. 

Data Tables - Kidney Cancer

References

[1] American Cancer Society, Kidney Cancer: 2024 May 1: Available at: https://www.cancer.org/cancer/kidney-cancer/about/key-statistics.html

[2] Scelo G, Larose TL. Epidemiology and Risk Factors for Kidney Cancer. J Clin Oncol. 2018 Oct 29;36(36):JCO2018791905. doi: 10.1200/JCO.2018.79.1905. 

[3] Kase AM, George DJ, Ramalingam S. Clear Cell Renal Cell Carcinoma: From Biology to Treatment. Cancers (Basel). 2023 Jan 21;15(3):665. doi: 10.3390/cancers15030665. 

[4] Rossi, S. H., Klatte, T., Usher-Smith, J., & Stewart, G. D. (2018). Epidemiology and screening for renal cancer. World journal of urology, 36(9), 1341-1353.  

Pancreatic Cancer

Pancreatic cancer is the 10th most common cancer and the 5th most common cause of cancer mortality, in the Greater Bay Area. Pancreatic cancer is often detected at a later stage due to its rapid spread and the lack of symptoms in the early stages. Later stages are associated with symptoms, but these can be non-specific, such as lack of appetite and weight loss [1]. Smoking, obesity, personal or family history of diabetes or pancreatitis, occupational exposure to some chemicals, and certain hereditary conditions have been associated with risk of pancreatic cancer. Pancreatic adenocarcinoma is the most common type of pancreatic cancer, accounting for approximately 95% of pancreatic cancers [1].

Data Tables - Pancreatic Cancer

References

[1] National Cancer Institute, SEER Cancer Statistics Fact Sheets: Pancreatic Cancer. Available at: http://seer.cancer.gov/statfacts/html/pancreas.html.  U.S. Department of Health and Human Services, National Cancer Institute, Bethesda, MD.